
Author: admin

Diamante sintetico: un problema commerciale per il futuro?

Diamante sintetico: un problema commerciale per il futuro?

una relazione di Antonello Donini

Stiamo parlando di DIAMANTE SINTETICO.
Carbonio (C)  cristallizzato nel sistema cubico disposto nel reticolo secondo la configurazione spaziale tetraedrica.
Come accade nel diamante naturale tale configurazione conferisce a  questo materiale proprietà che lo rendono unico nel suo genere.

Non parliamo quindi di una imitazione ma di vero e proprio diamante prodotto con metodi artificiali di sintesi fatti dall’uomo e non dalla natura.

I primi tentativi di  realizzare in laboratorio l’esatta controparte sintetica del diamante sono databili intorno alla fine del 19° secolo, ma  il primo successo storicamente documentato risale alla prima metà degli anni ’50 del 20° secolo, quando i ricercatori dell’americana General Electric hanno sintetizzato i primi piccoli cristalli di diamante.

Sempre la General Electric, circa 20 anni dopo, ha realizzato i primi diamanti sintetici aventi dimensioni sufficienti per poter avere un utilizzo come gemma, seguita negli  anni ’80 dalla giapponese Sumitomo, dalla De Beers e verso l’inizio degli anni ’90, da laboratori  russi.

Metodi di sintesi

Metodo di produzione HPHT

Il metodo si basa sulle condizioni che hanno permesso in natura la formazione del diamante ovvero alte pressioni ed alte temperature.

All’interno delle celle di reazione contenenti  cristalli-seme, una lega/soluzione metallica (ad esempio nickel e ferro) che funge da fondente/catalizzatore, il nutriente (solitamente grafite) viene esposto a condizioni di alte pressioni ed alte temperature (tra 1400 e 1600°C e tra 50 e 60 kbar) grazie a elementi riscaldanti e presse.
Il carbonio si dissolve nel fondente e si deposita quindi sui cristalli seme posti solitamente in una zona della cella con temperatura inferiore sotto forma di diamante.

Metodo HPHT  BARS

Metodo HPHT  TOROID

Metodo HPHT  CUBOID

Una importante problematica da affrontare per questo metodo di sintesi è quello di tenere lontana la presenza di azoto responsabile di una colorazione verde giallo alla bruna dei cristalli sintetizzati.
L’utilizzo di nuove leghe metalliche utilizzate come fondenti, con l’aggiunta di particolari elementi (come alluminio, cobalto o rame) che permettono di fissare l’azoto facendo in modo che non rientri nel reticolo del diamante.

Si ottengono così diamanti incolori (tipo Iia) o con lieve colorazione  bluastra per la presenza di lievissime quantità di boro (tipo IIb).

DIAMANTE SINTETICO CVD

Ha il grosso vantaggio di avvenire a basse pressioni, nell’ordine di 10-200 torr.

Nella camera viene creato un plasma che rompe la molecola di metano o altro gas contenente C.

Il carbonio si va quindi poi a depositare sotto forma di diamante su un substrato solitamente costituito da sottili semi di diamante.

Elementi utili alla identificazione

I diamanti sintetici incolori CVD sono in generale del tipo IIa ovvero composti da solo carbonio.

Per eliminare una possibile componente bruna presente nei diamanti cristallizzati con questo metodo dovuta a dislocazioni, vengono sottoposti a un post trattamento HPHT in grado di eliminarla.

Al microscopio i diamanti sintetici HPHT mostrano spesso caratteristiche figure di crescita, correlate ai settori di crescita cubici e ottaedrici.

È possibile rilevarle in corrispondenza di zonature di diversa fluorescenza o nella distribuzione del colore all’interno della pietra che segue questi settori di crescita.
Le inclusioni  caratteristiche, ma non sempre presenti, sono residui di fondente che si presentano come inclusioni nere e opache con lustro metallico.

Zonature di colore e linee di struttura in diamante sintetico  HPHT che seguono i settori di crescita

Le inclusioni  caratteristiche, ma non sempre presenti, sono residui di fondente che si presentano come inclusioni nere e opache con lustro metallico o estesi gruppi di inclusioni puntiformi (probabilmente minute particelle di fondente disperso).

Inclusioni di fondente metallico  in diamanti sintetici incolori HPHT

Esempi di inclusioni in diamante sintetico HPHT

I diamanti sintetici CVD potrebbero avere minute inclusioni scure (residui carboniosi) con aloni di tensione probabilmente generati da un post trattamento termico utilizzato per migliorare il colore delle gemme.

Esempi di inclusioni in diamanti cvd

Molti diamanti sintetici HPHT mostrano una caratteristica fluorescenza da gialla a verde giallastra agli UVL (365 nm) e agli UVC (254 nm).

Le impurità che vengono assorbite nella struttura del diamante sintetico durante la sua crescita tendono a concentrarsi ciascuna in determinati settori di crescita, ciò origina caratteristiche figure di fluorescenza, a forma di croce o ottagonali, mai viste in diamanti naturali.

Spesso, a differenza di quanto accade nei naturali, la reazione è più intensa all’onda corta che a quella lunga.

I diamanti naturali generalmente mostrano una fluorescenza più o meno marcata di colore blu (più raramente gialla e, meno comunemente ancora, verde o rosa), abbastanza uniforme e, comunque,  più marcata all’onda lunga che all’onda corta.

Effetti di luminescenza che seguono le direzioni di crescita cubo-ottaedriche in un diamante

La presenza di fosforescenza solitamente persistente (rarissima in natura e atipica nelle pietre incolori) è un buon segno identificativo.
Sono infatti i diamanti di tipo IIb estremamente rari in natura (contenenti boro) che presentano questo effetto solitamente di breve durata.

Una caratteristica particolare dei diamanti prodotti con il metodo HPHT è quello di mostrare poche o lievi birifrangenze anomale al contrario dei diamanti naturali. Nei sintetici CVD le birifrangenze anomale sono generalmente simili a quelle dei diamanti di tipo IIa naturali ovvero con una specie  di graticcio, spesso orientato secondo la direzione di deposizione dei cristalli.

Esistono però cristalli sintetici CVD di qualità “ottica” (QUINDI OTTICAMENTE PERFETTI ED OMOGENEI) privi di birifrangenze anomale.

Birifrangenze anomale in diamante sintetico HPHT. Quando presenti assumono la forma di una croce

Birifrangenze anomale in diamante sintetico CVD

Identificazione certa solo attraverso tecniche analitiche avanzate

La spettrofotometria IR (infrarosso) è un ottimo aiuto per riconoscere la tipologia del diamante ovvero per verificare la presenza o assenza di tracce di alcuni elementi fondamentali. SI hanno così potenziali informazioni per isolare tipologie di diamante che potrebbero essere compatibili con una produzione sintetica.

I Diamanti sintetici incolori sono di tipo IIa (azoto presente in quantità talmente piccola da non poter essere rilevato strumentalmente con IR), mentre quelli blu, come i loro analoghi naturali, sono di tipo IIb (presenza di boro). La presenza del tipo IIb ovvero di tracce di boro è riscontrabile spesso in moltissimi diamanti sintetici incolori. Sono stati anche visti in commercio diamanti sintetici di colore rosa dovuto ad un post trattamento per irraggiamento e successivo riscaldamento a bassa temperatura. E’ bene ricordare che le prime produzioni, proprio per la presenza di azoto prevedevano colorazioni nel giallo con diverse sfumature di bruno o bruno verdastro. Alcuni diamanti di questo tipo trattati per irraggiamento hanno assunto un vivacissimo colore rosso.

Allo spettrofotomentro UV-VIS-NIR la componente Ib presente nei diamanti sintetici giallo verdi genera un assorbimento a partire dai 500 nm verso l’ultravioletto.
Molti diamanti mostrano, una serie di assorbimenti tra 470 nm e 700 nm, dei quali il più evidente è a  658 nm. Questi picchi sono dovuti alla presenza di nickel all’interno della struttura cristallina presente nel catalizzatore.
I diamanti incolori sintetici di tipo IIa sono trasparenti sino a 270 nm.

Presenza di elementi come nickel, ferro, alluminio, cobalto, rame o gli altri metalli impiegati nella crescita, possono essere identificati mediante un’analisi chimica con fluorescenza ai raggi X (EDXRF).

Attraverso la Fotoluminescenza è possibile rilevare centri di colore diagnostici grazie alle tracce di impurità presenti   quindi riconoscere la natura sintetica.

La osservazione degli effetti di luminescenza ad uv molto corti può essere molto utile per riconoscere i diamanti sintetici.  

Quadro della situazione commerciale

I produttori di diamanti sintetico sostengono che:

I diamanti prodotti artificialmente in laboratorio hanno essenzialmente la stessa composizione chimica, struttura cristallina, proprietà ottiche e fisiche dei diamanti estratti dalle miniere: sono quindi diamanti al 100%. L’unica differenza tra i diamanti sintetici e quelli estratti è che uno è stato creato all’interno ed estratto dalla Terra e l’altro è stato creato in un laboratorio all’avanguardia.

Sono numerosi i produttori che sintetizzano diamante soprattutto per scopi industriali.

In gioielleria la dimensione delle gemme sfaccettate ha raggiunto dimensioni decisamente importanti: sono state viste gemme di oltre 10 ct. Ma la maggiore diffusione di questo prodotto si ha su gemme fino ad un max di 2,00 ct e nei lotti melèe (da meno di un punto fino a 0,25 ct).

Costante crescita e diffusione nel settore orafo dell’utilizzo di questo materiale gemmologico, trascinato dall’intensivo e sempre maggiore impiego industriale di questo materiale.
Ampiamente utilizzato negli strumenti come superabrasivi, mole, utensili da taglio, strumenti di perforazione e lucidatura, prodotti dell’industria automobilistica, medica, aerospaziale ed elettronica.

Per i costi di manifattura e per importanza di mercato fanno la parte del leone i paesi asiatici, seguiti dal nord America.

Commercialmente stanno avendo un forte spunto e diffusione soprattutto negli USA e in Giappone.

A fornire un forte discapito per chi tratta il naturale, la FTC statunitense (Federal Trade Commission, organo legislativo commerciale) ha permesso che queste sintesi potessero essere chiamate come “grown diamonds”.
Ha inoltre stabilito che il “diamante sintetico” è da considerarsi come vero e proprio “diamante” permettendo ai produttori di sintetici di commercializzare i loro prodotti come «reali» / «veri» (real diamonds).

Il resto del mondo e le norme ISO internazionali prevedono che questo materiale gemmologico debba essere chiamato, ai fini della chiarezza nei confronti del consumatore solo come  “diamante sintetico” al pari di qualsiasi altra sintesi.
Nessuna altra definizione o semplificazione è ammessa.
ISO 18323:2015

Il costo di questo materiale è attualmente inferiore al naturale di circa il 30-40% ma sono previste ulteriori diminuzioni dovute ad una sempre maggiore diffusione e alla riduzione dei costi di produzione.

I diamanti sintetici rappresentano attualmente circa Il 2% del mercato globale.
Ci si aspetta che entro il 2030 tale quota possa salire al 10%.
Per pietre con peso attorno al 0,50-1,50 ct, adatte ad un impiego come solitario ovvero per un anello da fidanzamento la quota del 7,5% potrebbero essere raggiunta già nel 2020.

Per il «melèe» si potrebbe arrivare ad una quota del 15% nei prossimi due anni.

La diffusione di questo materiale nel melèe potrebbe essere intensificata da una progressiva  scarsità di diamanti estratti in natura in quanto è attesa la chiusura della miniera di Argyle (ormai quasi esausta) che attualmente fornisce la maggior parte dei diamanti piccoli del mondo.

Difficile quindi fare oggi delle previsioni su quale sarà il reale impatto di questo materiale sul mercato dei preziosi.

Le nuove generazioni sembrano, dagli studi di marketing, positivamente favorevoli all’utilizzo di questo nuovo materiale in ornamentazione.

Il diamante sta perdendo quel fascino di pietra simbolo di rarità e amore eterno per raggiungere sempre più lo status di gemma a larga diffusione.
I consumatori iniziano  a percepire i diamanti sintetici come allettanti: è possibile avere gemme più grandi a prezzi più bassi e, soprattutto, fare un investimento «privo di sensi di colpa».
È attiva una importante operazione mediatica per pubblicizzare queste gemme come maggiormente “etiche” rispetto le naturali.
I giovani, essendo giustamente orientati all’ambiente e al non sfruttamento di risorse naturali e soprattutto umane, mostrano maggiore interesse per questo tipo di gemme, rispetto le generazioni precedenti coinvolte maggiormente sulla unicità e rarità del singolo gioiello.

Grossi nomi dello spettacolo e del mondo web come Di Caprio, Lady Gaga, Penelope Cruz o i possessori di Facebook, Twitter e eBay hanno pubblicizzato o persino finanziato strutture per la produzione di diamanti sintetici, credendo nel loro futuro.
La Diamond Foundry uno degli ultimi produttori statunitensi comparsi sul mercato ha dichiarato di essere attualmente l’unico produttore di diamanti certificato “carbon neutral”, in quanto i suoi diamanti sono fabbricati in un reattore al plasma ad energia idroelettrica.
Sostiene inoltre che: “l’estrazione mineraria ha un impatto ambientale maggiore rispetto a qualsiasi altra attività umana. Per un singolo carato di diamante, devono essere scavate circa 250 tonnellate di terra, e vengono rilasciati notevoli quantità di inquinamento atmosferico con l’emissione pesante di anidride carbonica”.

De Beers attraverso il marchio LIGHTBOX ha iniziato la commercializzazione on-line di linee di gioielleria con diamanti sintetici incolori, azzurri e rosa ad un costo molto basso cercando di accaparrarsi una importante fetta di mercato mondiale. (1.00 ct 800,00 US$ – 0.50 ct 400.00 US$ – 0.25 ct 250.00 US$).

Dagli studi più del 60% degli intervistati sarebbero disposti, interessati all’acquisto di un diamante sintetico su un anello di fidanzamento, per il costo inferiore del materiale permettendo così di avere gemme di dimensione maggiore ad un costo inferiore.

I consumatori con disponibilità economica solitamente più legati al fascino, al mistico all’unico  e all’irripetibile…sembrano invece mostrare molto interesse per questo materiale.

I produttori di diamanti sintetici sono stati in grado di interessare i cosiddetti «millennials» promuovendo il Lab Grown Diamond  come high-tech, innovativo e pulito.

In tutti gli aspetti della loro vita cercano marchi, aziende e prodotti che ritengono trasparenti, socialmente e rispettosi dell’ambiente.

Il consumatore non crede ormai più nel valore dei diamanti o del gioiello in generale.

Ci sono infatti stati nel tempo diversi fattori che hanno diffuso sfiducia nel settore.

  • Operatori commerciali poco trasparenti
  • Scarsa conoscenza dei materiali e del mercato da parte degli operatori
  • Scarsa resa dei diamanti da investimento
  • Poche certezze

Occorre però tener conto che: un diamante naturale anche se di brutta qualità avrà sempre un possibile acquirente.
Non esiste invece un mercato secondario per i diamanti sintetici, soprattutto perché i commercianti di diamanti attuali tendenzialmente non li trattano.
Il «buon affare», il risparmio che si può avere acquistando un diamante sintetico, sfuma quando si pensa al fatto che sarà impossibile rivenderlo.

Al momento il quadro è decisamente confuso, poco chiaro. Gli operatori del mondo, dati gli interessi economici che ruotano attorno al materiale naturale, sono decisamente preoccupati e spaventati dalla improvvisa diffusione e dal numero delle operazioni mediatiche che stanno ruotando attorno al diamante sintetico.

Ma se guardiamo al passato quello che sta accadendo ora è stato promosso nello stesso ed identico modo in passato quando DeBeers all’inizio del secolo scorso attraverso operazioni mediatiche mirate e personaggi dello spettacolo (pensiamo a Marylin Monroe e alla frasi «i diamanti sono i migliori amici delle ragazze» e «li diamante è per sempre») ha diffuso l’uso del diamante in gioielleria in modo che potesse diventare per tutti «simbolo di vero amore eterno».

Quindi difficile dare una risposta al quesito iniziale anzi, possiamo aggiungere ora un altro quesito: “il diamante sintetico potrebbe essere una opportunità?”


Continue reading

Applications of additive technologies in jewelry production

Applications of additive technologies in jewelry production

Laser metal fusion is also known as 3d metal printing and is now the field of additive manufacturing industry with the greatest potential for development and growth.

A high intensity laser selectively melts the metallic powders following a course defined by cad design and creating three-dimensional metal objects.

A variety of metals can be used with LMF technology including steel and bronze, which are the most common, and gold and platinum which are now being researched and closely examined. Our experience in additive printing began from this research a few years ago with the collaboration of sisma.

We started with a few tests and we immediately realized that additive production has certain characteristics that make it unique.

Let’s take a closer look

Additive production has particular characteristics that make it unique:

No cost for creating production moulds, tools and equipment

Reduction in costs and in design to prototype times

Reduced production scrap and environmental protection

Maximum freedom in the design stage. In fact, LMF can create extremely complex shapes that cannot be made with other technologies.

In detail:

– 1 – no cost for creating production moulds, tools and equipment

With LMF, precise machine centring, to be used, for example, for laser engraving, can be done simply and at a contained cost and blocking mechanisms for creating serial items and small prints can be used that reduce both costs in the production phase and re-production times.

– 2 – reduction in costs and in design to prototype times

Creating a model and arriving at the master copy is much faster with LMF than going through the classical production channels. The visual perception on video of the created item is followed a few hours later by its tactile perception, notably cutting verification times for creating the master copy.

– 3 -reduced production scrap and environmental protection

Producing with LMF means reducing waste and energy consumption. In traditional processing methods, micro-casting, for example, many steps are required to create an object involving wax, rubber and plaster scrap. The time of the entire production process with LMF is radically reduced and scrap with
it.

– 4 -maximum freedom in the design phase. LMF can create extremely complex shapes that cannot be made with other technologies

The advantages of direct metal printing compared to lost wax casting are incredible both in terms of precision and geometric possibilities. One example is jewellery that looks like sculpture. Nuovi Gioielli’s experience with LMF stemmed from the desire to approach new technologies and production
techniques to accompany artisan workmanship. With LMF, the design is always new and many creative limitations, often due to traditional processing techniques and the many production stages, can be avoided with this technique.

An object like the one you can see, can be made with one single process.

Having control over the results that we want to achieve, creativity can be expressed without limits, uniting aesthetics, production and architectonic technique into one single item.

The designer controls the whole production process, from the creative phase to powder verification, from fusion to the post process.

METALPIXEL

Research and development into LMF processes have led us to create METALPIXEL

In 1800, jacquard revolutionized the 19
th century textile sector and, thanks to this special loom, we can still create complex designs and innumerable patterns for the clothes we wear.

More than 200 years later, Nuovi Gioielli, using LMF technology, applies the softness of fabric and jaquard patterns to metal. The result is something quite unique that has many applications, not only in the jewellery sector but also in the much wider fashion and design industry.

Imagine a shirt cuff, imagine an insert in a bag or simply imagine, because METALPIXEL can be anything and everything you want.

Fabrics and their patterns have always been the essence of fashion. Metal, due to its solidness, has always taken a backseat in the accessory world. Now, with this new processing technique, it can become an integral part of a new way of conceiving textiles, softness and customs.

Continue reading

Lo scenario macroeconomico per il settore orafo

Lo scenario macroeconomico per il settore orafo

Il terzo trimestre 2018 ha visto la domanda mondiale di gioielleria in oro registrare un andamento positivo, con un vero e proprio rimbalzo delle quantità (+6%) dopo i dati fiacchi o negativi dei trimestri precedenti. Secondo il World Gold Council, la debolezza dei prezzi dell’oro ha stimolato gli
acquisti, in particolare in India (in recupero dopo gli scorsi trimestri in calo), in Cina (favoriti anche dalla festa di Qixi, equivalente cinese di San Valentino) ed in molti altri mercati del Sud Est Asiatico. Ancora in difficoltà, invece, sempre secondo le statistiche diffuse dal World Gold
Council, i paesi del Medio Oriente.

Fig. 1 – Domanda mondiale

 Fonte: elaborazioni Intesa Sanpaolo su dati World Gold Council – Gold Demand Trend

Il rimbalzo della domanda mondiale di gioielleria in oro, a fronte di prezzi in calo, si è riflesso anche nella dinamica delle esportazioni italiane. Nel terzo trimestre è, infatti, proseguito l’andamento negativo delle esportazioni di gioielleria in oro (-8,8% la variazione tendenziale dei valori
in euro), conseguente anche al confronto con un 2017 particolarmente brillante. L’evoluzione delle quantità ha, invece, registrato un significativo balzo in avanti (+35,7%), che sottintende bruschi movimenti nei valori medi unitari (VMU, valori divisi per le quantità).

Fig. 2 – Evoluzione delle esportazioni di gioielli in oro* (var. % tendenziali)

 Nota: (*) Codice 711319. Fonte: elaborazioni Intesa Sanpaolo su dati Istat

Nel complesso dei primi nove mesi, le vendite all’estero sono diminuite del 4,1% in valore, mentre sono aumentate del 20,8% in quantità (per un ammontare pari a 28 tonnellate), implicando una diminuzione dei valori medi unitari pari al 20% circa nella media dei paesi.

Il dettaglio geografico evidenzia come il calo dei valori in euro sia diffuso a quasi tutte le principali destinazioni, con l’eccezione degli Stati Uniti (+3,2%), del Regno Unito (+27,2%) e del Sud Africa (+12%). Allo stesso modo l’andamento espansivo delle quantità ha riguardato tutti i paesi, con
solamente gli Emirati Arabi Uniti a registrare un calo del 15,2%, confermandosi come uno dei mercati dove le vendite di gioielleria in oro Made in Italy soffrono maggiormente.

Tabella 1 – Evoluzione delle esportazioni di gioielli in oro* nei primi nove mesi 2018

(var. % tendenziali)


Spicca il dato francese: gli invii di gioielli in oro verso la Francia nei primi nove mesi del 2018 sono cresciuti addirittura dell’86,6%, pari a 7 tonnellate in più rispetto allo stesso periodo del 2017, con un contestuale crollo dei valori medi unitari di oltre il 50%, che potrebbe anche riflettere
modifiche nella fissazione dei transfer price all’interno dei gruppi multinazionali francesi con basi produttive nel settore in Italia. Va infatti sottolineato come lo scorso anno i valori medi unitari impliciti nei flussi di export dall’Italia alla Francia avessero raggiunto livelli particolarmente
elevati rispetto al dato medio nazionale (con un balzo del 32%). Si tratterebbe, pertanto, di una sorta di “normalizzazione” sui livelli medi registrati negli anni precedenti. I dati relativi al terzo trimestre, poi, evidenziano un recupero di ritmi positivi dell’export verso la Francia anche
in termini di valori (+16%).

Anche nei confronti degli Stati Uniti le quantità di gioielli in oro esportate hanno registrato un notevole incremento (+51,4%, pari a 5 tonnellate aggiuntive), sottolineando il forte interesse di questo mercato per il gioiello italiano, in questo caso espresso anche dai dati in valore.

L’andamento positivo delle quantità vendute all’estero è coerente con l’evoluzione ancora fortemente in crescita dell’indice della produzione industriale del settore (che include anche la bigiotteria e l’argenteria). La produzione ha registrato nei primi 10 mesi una crescita dell’8,3%, con una
nuova significativa accelerazione nel mese di ottobre. Si tratta di un ritmo di sviluppo molto elevato (sebbene in rallentamento rispetto al +17,4% medio del 2017), nettamente superiore al +2,6% tendenziale registrato in media dalla produzione manifatturiera italiana nello stesso periodo.

Fig.  3 – Evoluzione dell’indice di produzione industriale (var. % tendenziale, dati grezzi)


Fig.  4 – Evoluzione dell’indice di fatturato

(var. % tendenziale, dati grezzi)


 Fonte: elaborazioni su dati ISTAT


 Fonte: elaborazioni su dati ISTAT

Anche l’indice di fatturato (che è in valore) è rimasto in crescita, sebbene in questo caso il rallentamento rispetto ai dati del 2017 sia stato tale da riportare il settore dell’oreficeria e bigiotteria sugli stessi ritmi del manifatturiero.

A livello territoriale, dove i dati sono disponibili solamente in valore e per l’aggregato che include anche la bigiotteria, i primi nove mesi dell’anno hanno confermato l’andamento in calo visto a livello nazionale. In particolare, nel complesso dei primi nove mesi dell’anno è stata Vicenza
a registrare la diminuzione più pronunciata dei valori (-4,8%), con un netto peggioramento nei mesi estivi (-8,1% la variazione tendenziale registrata tra luglio e settembre 2018 ed il corrispondente periodo del 2017). In forte frenata nel terzo trimestre anche l’export di Arezzo (-7,1%),
che porta il dato dei primi nove mesi a -2,3%. Rimane stabile sui ritmi (sempre negativi) della prima parte dell’anno l’export di Valenza Po (misurato come per gli altri poli produttivi con il dato relativo all’intero territorio provinciale).

Fig. 5 – Evoluzione delle esportazioni di gioielleria e bigiotteria (var. % tendenziali in valore su dati provinciali)

Fonte: elaborazioni su dati ISTAT

Nel dettaglio, per Vicenza, i dati negativi hanno riguardato molti mercati, in particolare quelli emergenti: Hong Kong (-16,4% nei primi nove mesi), Emirati Arabi Uniti (-19,2%), Giordania (‑32,4%), Romania (-22,3%) e Turchia (-12,8%). Spiccano, in particolare, i veri e propri crolli
di cui sono stati protagonisti durante i mesi estivi i valori esportati verso la Giordania (-56,4%) e la Turchia (-42%).

Da sottolineare invece come, all’opposto, gli Stati Uniti (primo mercato di sbocco nel 2017) abbiano registrato un andamento stabile nella media dei primi nove mesi, ma con un miglioramento durante il terzo trimestre. Segnali di recupero anche nelle esportazioni verso il Regno Unito (dopo
il risultato negativo del 2017), che con i dati del terzo trimestre sembrano aver arrestato la caduta; bene anche l’export diretto in Sudafrica, in netta accelerazione nel terzo trimestre.

Tab. 2 – Esportazioni del distretto orafo di Vicenza

Fonte: elaborazioni su dati ISTAT

Anche le esportazioni di Arezzo stanno continuando a risentire di cali importanti e continui negli Emirati Arabi Uniti (-17,9% tra gennaio e settembre, con un -27% nel terzo trimestre). Come Vicenza, poi, anche Arezzo ha visto un brusco peggioramento delle vendite in Turchia, con un ‑26,7%
maturato nei mesi estivi. Migliorano, invece, i risultati verso gli USA, tornati in territorio positivo tra luglio e settembre, ma non sufficientemente da riportare in crescita il dato complessivo dei primi nove mesi del 2018 (-8,2%). Rispetto a Vicenza, invece, Arezzo riesce a mantenere
su buoni livelli le vendite ad Hong Kong: dopo l’eccezionale +21,6% del 2017, l’export di Arezzo è cresciuto dell’1,8% nei primi nove mesi. Bene anche il ritmo di sviluppo del mercato francese (rimasto intorno al +20%); da sottolineare infine gli ottimi risultati di vendita, sebbene su
livelli limitati, che hanno interessato Panama ed il Libano.

Tab. 3 – Esportazioni del distretto orafo di Arezzo

Fonte: elaborazioni su dati ISTAT


L’export di Valenza Po è invece nettamente più concentrato dal punto di vista geografico, con quasi i tre quarti delle vendite focalizzate su Svizzera e Francia. Come evidenziato anche a livello nazionale, è in particolare il risultato verso la Francia a condizionare i dati complessivi. Nei
primi nove mesi del 2018 gli invii di oreficeria da Valenza alla Francia hanno sperimentato un calo del 20,9%, per poi migliorare in modo importante durante l’estate. L’export verso la Svizzera ha invece evidenziato nei dati più recenti un brusco peggioramento (-10,3%) dopo una prima
parte dell’anno più tonica, così come è avvenuto anche per l’export diretto verso gli USA (-9,8% nel terzo trimestre che lascia comunque il complesso dei primi nove mesi in territorio positivo, +3%). Male, dopo lo straordinario +55,2% del 2017, l’export diretto ad Hong Kong (-14,6%, in
peggioramento a -25,6% nel periodo luglio-settembre).

Tab. 4 – Esportazioni del distretto orafo di Valenza Po

Fonte: elaborazioni su dati ISTAT

Le prospettive per i mesi conclusivi dell’anno sembrano improntate ad un cauto ottimismo. Il risveglio della domanda mondiale, seppure in un contesto di elevata incertezza, porta a ritenere probabile il proseguimento, anche negli ultimi mesi dell’anno, delle tendenze riscontrate nella prima
parte. Ci aspettiamo che la domanda proveniente dai mercati asiatici e dagli Stati Uniti continui a mantenersi tonica, mentre dovrebbero proseguire le difficoltà riscontrate nei paesi del Medio Oriente.

Le prospettive per il 2019 appaiono più incerte, condizionate dal possibile recupero dei prezzi dei preziosi (si veda il prossimo paragrafo) che potrebbero avere un impatto negativo sui segnali di risveglio della domanda di gioielli registrati nella seconda metà del 2018. Nel nostro scenario,
comunque, il prezzo dell’oro dovrebbe rimanere – in media d’anno – intorno ai 1,250 USD all’oncia, un livello di poco inferiore rispetto a quello medio del 2018.

Continue reading

Responsibly Sourced Artisanal Gold: A Tour of Peruvian and Colombian Mining Communities

Responsibly Sourced Artisanal Gold: A Tour of Peruvian and Colombian Mining Communities.

What is ASM or Artisanal and small-scale mining?

Artisanal and small-scale mining can best be described as ‘low intensity’ mining, encompassing all types of mining from alluvial deposits to hard rock extraction1. Estimates vary, but in general it is accepted that ASM’s provide about 20% of the gold mined each year but employ about 80% of the mining
population. Operations tend to be informal, very low technology based and labor intensive. In many cases, miners use hand tools such as hammers and chisels, with the more advanced operations using nothing more complex than small scale excavation equipment such as back-hoes and dump trucks. ASM communities
also tend to be very marginalized and have little access to resources, particularly state or industry support. In many cases the need to mine is poverty driven and mining operations are often excluded from the normal banking sector, many having no bank accounts or access to credit. A sad consequence
of this is that many are subject to criminal activity in many forms.

The aim of both the Fairmined and Fairtrade organizations is to improve the above situation. By introducing standards which ensure that all gold and silver produced at artisanal and small-scale mining operations certified by the respective organization are mined in a responsible manner, they improve
the lives and working conditions of miners and mining communities. Once the mine becomes certified, they are not only guaranteed a fair price for the metals they sell, but also a premium to be paid directly to the mine by the purchaser for every gram of gold and silver purchased.

It must be noted that there is not enough ASM gold mined to fulfill all of the requirements for gold, whether for jewelry, electronics or medical uses. The point of responsible sourcing is not to eradicate industrial scale mining, it is to improve the lives and working conditions of miners and mining
communities in the developing world. Many customers, particularly those described as Generation X and Millennials, have different, less traditional buying habits. They want a story, something they can relate to, they want their purchases to make a difference socially and environmentally. This makes
responsible sourcing of gold and silver very relevant in today’s jewelry market.

Figure 1. Miners at the Sotrami mine, Peru.

Figure 1 shows a husband and wife who work at the Sotrami mine at Santa Filomena in Peru. This is a small scale mine employing 700 workers of which 160 are miners working at the face. Some mines are privately owned, and some, like Sotrami, operate as cooperatives while others are lone operators or single-family
operations.

Mercury use.

Both Fairmined and Fairtrade are concerned with mining communities in the developing world, and with this comes many problems with unregulated artisanal and small-scale mining. One of the biggest problems is the use of mercury. Extracting gold using mercury is a relatively inexpensive, simple and quick
process. Gold bearing ore is crushed into a sand like consistency and mercury is mixed in, usually with your hands and in many cases your feet as well. The resulting amalgam is then separated from the waste products and the mercury burnt off to leave gold typically of around 75% to 80% pure.

Figure 2. Using mercury to extract gold from ore
2.

Figure 3. Mercury-gold amalgam
2.

Figure 4. Burning off mercury
3.

Unfortunately, mercury is also highly toxic, and not just the liquid mercury. The fumes from burning off mercury are also highly toxic. Heavy and prolonged exposure causes irreversible damage to the human body. Mercury poisoning damages the brain, heart, lungs, kidneys and immune system. It results in
birth defects with many children born to mothers who have mercury poisoning being educationally subnormal with decreased intelligence. Mercury contamination also results in a toxicized ecosystem ‘ water, plant life, fish and animals are all affected. Because of bioaccumulation, mercury works its way
up the food chain and can bio-magnify and increase concentration in certain plant and animal species4. This is a major reason to use certified ASM gold and silver ‘ to guarantee that mercury has not been used in the gold extraction process.

Responsibilities for Mine Certification.

For a mine to become Fairmined or Fairtrade certified, certain criteria must be fulfilled (1,5,6):

Mines are required to participate in the social development of their communities.

Mines must eliminate child labor from their organization. No one under the age of 15 can be contracted to work in the mining organization and under 18’s must work in non-hazardous conditions.

There must be health and safety training for all employees and minimum health and safety standards must be met. Mandatory use of personal protective gear must be observed and enforced at all times, and working conditions continuously improved.

The mines must recognize and respect the rights of employees to form or join trade unions and collectively negotiate their working conditions – freedom of association and collective bargaining.

The responsible use of chemicals is mandatory. If mercury is used in the extraction process it must be controlled and plans/timelines agreed to eliminate its use altogether. If cyanide processing is used it must be handled using responsible practices. Chemicals have to be reduced to a minimum and wherever
possible eliminated over an agreed time period.

Responsible use of any premiums paid for under the Fairmined and Fairtrade certification schemes.

Why do Fairmined and Fairtrade metals cost so much?

The previous section describes the basic framework that mining organizations have to agree to and implement to comply to the standards and qualify for the premiums. From the jeweler’s point of view, a few of the questions most ask when looking to purchase responsibly sourced artisanal gold and silver
are why does it cost so much, where does this additional money go to and what is it used for? These are all very fair questions because certified ASM gold and silver is expensive and the jeweler pays considerably above market rate for the materials they purchase.

Normally, the gold and silver purchased by jewelry material suppliers is already in-country, they just call up their bullion supplier or refiner and buy it. However, with Fairmined and Fairtrade metals, unless your business is in Peru, Colombia, Bolivia, Mongolia or a few African countries, it isn’t
in-country and it has to be exported from the mine and then imported into your country of business.

Both Fairmined and Fairtrade use the same basic system. A fixed percentage of the gold or silver market price is agreed between the mine and the purchasing company, guaranteeing a fair price to the mine for their product. The Fairmined and Fairtrade purchasing procedures regulate this to prevent mines
being taken advantage of. As well as this agreed percentage of the gold or silver market price, the purchaser also pays a price per gram of fine metal purchased, and this is paid directly to the mine. All fees are paid prior to the metals being shipped from the mine. Additionally, there are transport,
insurance and logistics costs to get the metals from the mine to an airport, through customs export, onto a plane to your destination country, through customs import then from arrival airport to your plant.

This can be somewhat complex, however by doing this, the miners get a fair market value for the metals sold, and the payment of the premium directly to the mine which is then spent on both mine and community improvements. This premium typically, but not exclusively, gets banked and when it reaches a
certain amount, or after a certain time, the managers who run the mine or owners who run the cooperative decide what they should spend it on. They’re typically responsible in their choices, which are monitored, and listen to the community before deciding what to do but it is always spent for the good
of the mine and community.

Examples of how the premiums are spent range from safety equipment to medical needs, bringing mains electricity or running water to the community, or building schools and places of worship. In the case of one of the mines visited by the author, they decided the money would be best spent on mains electricity,
so they wired up the town. The next year they were looking into supplying mains water ‘all water has to be delivered by truck to the mine daily. But, after consultation, they decided to purchase a cell phone tower. Many of the mine workers do not permanently live on site but work there for three week
shifts, so communication with home and family is important to them, hence the cell phone tower.

Another item they purchased was a football pitch. They built a plateau out of waste rock from the mining operation and then had the pitch built on it ‘ they actually have two at this mine, one at about 1,900 meters and another at 2,750 meters. For the mine workers and community in general, this was an
extremely good spend. The workers now have a sporting activity they can do for both fitness and entertainment, and they have their own league that involves other mines, improving inter-community relations.

Figure 5. The cell phone tower at the Sotrami mine, Peru.

Figure 6. A football pitch at the Sotrami mine, Peru.

These are just two examples of what Fairmined and Fairtrade money has contributed to for a mining community. This money does good, helping to improve the work, the social environment and the community. This is the case with all Fairmined and Fairtrade mines.

In both Peru and Colombia there are two different types of ASM mining activity, these being regulated and unregulated mining activity.

Regulated Mining.

Mining accounts for only a small percentage of the GDP in Colombia however for Peru, about 15% of the GDP is from ‘on the books’ mining. There are no reliable figures regarding how much ‘off the books’ or ‘unregulated’ mining there is. The Government wants all mining activities to be legal and regulated
for a number of reasons. Primarily it will increase the tax base and help grow the economy. This tax base is used for many infrastructure projects and services such as building roads and construction, medical care and education to name a few. They also want to implement health and safety regulations
to safeguard the miners, and eradicate crime and exploitation. To encourage and incentivize miners to become legal and regulated, the government offers a 5% tax refund to a regulated mine for every kilo of gold exported.

Unregulated mining.

Unregulated mines are exactly as described and considered illegal. There are no rules and miners often work for little money under poor working conditions. Unregulated miners can die due to their working conditions, from poor health and safety, and the use of mercury and other chemicals. They are also
taken advantage of in many ways by criminals who exploit them, and unfortunately for many there is no way out of this cycle.

Unregulated mines are typically remote and difficult to reach. Those observed by the author in Peru were often high up in mountainous areas with no roads or tracks leading to them, and tens of kilometers away from the nearest paved roads. Everything needed for the mining operation has to be carried up
the mountainside either by donkey or by hand. Supplies such as food and water, tools and equipment, any wood for shoring up tunnels to make them safe, mercury to process the ore, all of these need to be transported to the remote areas where these mines exist. The mortality rate of the miners is relatively
high. Tunnels are unsupported ‘ they have to get wood to the general area first, then up the mountain, so often they don’t bother and the inevitable happens and tunnels can cave in. Problems with mercury poisoning are also high. In recent years at the request of the Peruvian government, the doctor at
Sotrami’s medical center tested blood samples from unregulated miners and found all to be over the safe legal limit for mercury. As a result of this the owners of the unregulated mines did not allow further tests to be carried out for fear of being closed down. The unregulated miners need the work and
so, as previously stated, get caught in the cycle.

Macdesa & Sotrami Mines, Peru.

The Macdesa and Sotrami mines lie within the Chaparra and Lucanas provinces respectively in Peru, about 600km south of Lima and roughly in between Nazca and Arequipa. Both of these provinces are in the Atacama Desert, which is the driest places on Earth. This is predominantly a mountainous and dusty
region, with the dust being the fineness of cement. It is quite a challenging environment in which to mine and to live.’

The Macdesa mine started life as a hole in the ground like all the other mines in the region. Many of these mines were left idle after Peruvian independence from Spain in 1821. When people started resuming mining, a relatively recent thing, the area was very much the ‘wild west’ with rival mining groups
fighting each other. Miners were barely making a living, safety was non-existent and life was very hard. As a consequence of this, at Macdesa, about 350 miners agreed that the only way to improve was to work together and form a community.

Macdesa is about 1,500 meters in altitude and at the beginning, the miners used hand tools and wheelbarrows to move ore from the mine. They would load approximately 60kg of ore from the mine into sacks and carry these to their donkeys. Once these animals were loaded up, they were walked 50 kilometers
down the mountain to the processing plant near the coast and main highway. However, the miners were taken advantage of and were only given about 80% of the market value. To compound this, the scales were rigged, the assays were rigged, and the ore was processed incorrectly. As a result, the miners rarely
saw any more than 50% of the value of the gold they mined.

So, in order to improve their yields and payouts, the miners started processing ore themselves by hand with mercury, but didn’t really know what they were doing. They determined that they needed to invest in their own technology and hire people who did know what they were doing. The story was very similar
at Sotrami. The original 350 ‘Socio’s’ ‘ founders – took out just enough wages to live by. The remainder of the money they received for their gold was reinvested to solve their problems and improve their processes and yields. Other things they did were:

Purchased proper mining drills.

Made rock and dirt roads to get trucks up and down from the processing plant to the mine.

Improved housing for mine workers and their families.

Invested in safety equipment and implemented a training program for all workers.

Improved conditions in the mine. Air was pumped into the mining shafts to help prevent pulmonary problems. The walls & ceilings were shored up to make the tunnels safe. Rail tracks were installed in each tunnel to enable them to easily move the ore out of the mine.

They began to assay on-site. This way, they knew exactly what purity their dore bars were and so what to expect as a return.

They developed processes to become mercury-free.

They purchased a boring machine, enabling them to test drill and see where the vein goes, greatly reducing the amount of mining needed and increasing their yield of gold recovered to ore mined.

The story for the Sotrami mine is similar. The founders formed the mine thirty one years ago and the village of Santa Filomena has grown around the mine at about 2,750 meters elevation. The population of Santa Filomena is ≈ 2,000, of which 700 work directly for the mine, with the remaining population
working support jobs. Similar to Macdesa, all the profits are invested back into the mine and the community. Workers work 20 days on, 10 days off which are unpaid, and usually eleven hour shifts. Many miners live away from the mine and travel home for their 10 days off to see family, but some have their
families with them, especially if both parents work at the mine.

Very often, local and national governments see mining as a kickstart industry. Thanks to the Mayor in the local town of Challa, who also involved the central government, 40km of asphalt road has been laid from the main Pacific Coast Highway, cutting the drive time to the mine in half. People in the lower
areas have taken advantage of the road and started crop farming, because now they can grow their produce and easily transport it to market without damaging it en route. In many cases where mining is a success story, its presence indirectly gives opportunities to others. The road is also important for
other reasons, one being that for Sotrami there is no running water onsite as such. All the water they need is transported up the mountain three times a day using three trucks.

Typically, nothing goes to waste. Rather than just discarding the rock, they use it for improvements. Waste rock is used to create flat areas which are then built on to expand the mine buildings and the town.

Figure 7. Waste rock used to create level building space at Sotrami, Peru.

Macdesa has three tunnels working their mine, whereas Sotrami only has one and all miners have to enter and exit the mine through this entrance and down this shaft. The mine is 630 meters deep, has 13 levels, and it takes the miners 35 minutes to climb down and 45 minutes to climb back up after completing
their shift.

Figure 8. The mine entrance at Sotrami, Peru.

Figure 9. The entrance shaft at Sotrami, Peru.

Figure 10. One of the mine tunnels at Sotrami, Peru.

Inside the mine, timbers are used to shore up the roof but generally there’s only lighting at the workface and for safety at the ore extraction rails. Although these timbers all have to be brought up from the coast because there are no trees growing in the vicinity of the mines, the good thing is that
the climate is so dry that there are no bugs to eat away at the wood and rot is generally not an issue.

Safety equipment must be worn by all when down the mines, particularly hard hats and especially respirators because the one thing that is a constant is the dust. The particles can cause serious lung problems if miners are unprotected. This is very different from the mines in Colombia, which are in an
entirely different environment.

Ore Processing: Hard Rock.

As far as ore processing is concerned both mines use similar processes. They both originally used mercury but understood the toxicity of this to themselves and the environment and so switched to a much more environmentally friendly cyanide process.

Figure 11. Large rotation barrel.

The ore is first crushed and then processed to the consistency of sand in a very large rotation barrel. Water is introduced to help the grinding process and also to form a slurry, which exits the barrel through a filter, making sure that the particles are small enough for downstream processing. Once
filtered, the slurry is pumped into cyanide treatment tanks. The gold present becomes suspended in the cyanide solution and is then pumped into reaction tanks containing activated carbon particles. The carbon particles are about the size of a grain of rice and they attract the gold, taking it out of
suspension. Typically, three successive tanks are used to maximize the gold yield; the process overall yields 96% of the gold entering the process as crushed ore.

At this point, the used cyanide solution is disposed of into cyanide waste pools. This may sound drastic, but the process is environmentally safe and not to be confused with the extremely environmentally damaging process of cyanide leaching, where the chemical is exposed to the ore in an untreated way
and comes into direct contact with the ecosystem with few or no constraints or containment. These cyanide waste pools have very durable membranes and the waste is chemically treated so that when it is exposed to ultra violet light it eventually converts to carbonates, making the waste pools non-toxic.
Once full, these pools are filled in then either planted or built on.

Figure 12. The slurry filter.

Figure 13. Activated carbon tanks.

Figure 14. A waste cyanide pool. The photograph is taken from a previous pool that has been filled, covered and planted.

Figure 15. Steel mesh electrodes in the plating tank.

The next part of the process is to filter out the gold laden carbon particles from the tanks, transfer these to an electrolytic cell and then plate the gold onto steel mesh. Once this part of the process is complete, the final part is to load the gold laden mesh into an oven and the gold is melted off
and cast into dore bars. The gold purity is now of the order of 80% and the product can be further processed or sold into the market as dore.

Spending the premiums.

As discussed earlier, premiums have been spent on various projects: mains electricity, running water, cell phone towers and football pitches. If the miners are asked why they do what they do and why they are happy to get certified by Fairmined and Fairtrade, there are numerous reasons. These include
environmental responsibility, better working conditions, prosperity, but they all agree that a major reason is for their children. These are relatively young enterprises and the mine workers want their children to have better lives and opportunities than they had. These miners came from virtually nothing,
created businesses and founded communities, and are flourishing.

A great example of this is their schools. At Macdesa, they have spent premium money on their kindergarten and elementary school, which are permanent block buildings, fenced in, clean, safe, and filled with computers. The children are taught how to use both the computers and the internet at a very early
age, and after school, the adults are also taught how to use computers, so they are put to very good use.

Figure 16. The elementary school at Macdesa.

Figure 17. Computers purchased with Fairmined and Fairtrade premiums.

The miners at Sotrami have used their premiums in similar ways. Sotrami has an excellent medical centre and this is very important not only for the mine, but also for the entire surrounding community. The mine funds this with their premiums, but they let anyone who needs it use it, regardless of whether
they are employed by Sotrami or not. They see it as their community duty to do so. It’s well equipped and they have a doctor assigned to them permanently. The next item on their wish list is an X-ray machine. Imagine having to travel 70km down a mountain on unpaved roads for X-rays on a broken bone.

The Peruvian mines discussed are success stories, and the same can be said for the Colombian mines.

Iquira, Coodmilla and Gualconda mines, Colombia.

The gold mines in Colombia discussed here are much smaller in scale than the Peruvian mines. The Iquira mine is in the Huila district, and the Coodmilla and Gualconda mines are in the Narino district, both areas being very lush and at altitude. Similar to the Peruvian mines, the mines in Narino are remote
and about a four-hour drive on unpaved roads from the nearest major highway.

Many of the same problems regarding regulated and unregulated mining in Colombia exist as noted for Peru, and until recently many areas of Colombia were dangerous and off limits to outsiders. There is still a great deal of illegal mining that the Colombian government wants to regulate, but implementation
has been a problem. Just telling miners they can’t mine anymore without providing any alternatives does not work. As a consequence, most communities don’t have an alternative and so go back to illegal mining just to survive. Colombia now has a formal ban on mercury but this is difficult to enforce for
various reasons. The Colombian government has also recently changed the banking laws as an anti-corruption and anti-terrorism countermeasure. A consequence of this is that several mining organizations have lost their ability to export their gold, however Fairmined is working with the mines and the government
to change this.

The Iquira Cooperative is southwest of Bogota in the Huila region of Colombia. This region is famous for coffee and a number of the miners at Iquira are also coffee farmers. The mines were on their land, they knew the gold was there, but they did not begin mining until 2004 when they organized as a cooperative
of 11 shareholders. By 2010 there were 35 cooperative shareholder members of which 8 are women and the co-op has 11 legally registered mines. Initially they would sell their gold informally to the local market, however becoming Fairmined certified has given them the ability to export.

Figure 18. Narino, Colombia
7.

Each mine is a separate business, but they all work as a cooperative for banking, selling and exporting purposes, resulting in better deals and reduced costs. These are relatively small mines and typically go about 500 meters into the mountain on one, two or three levels. About 20% of employment in Iquira
is by the cooperative and all of the workers come from the region.

Figure 19. A mine entrance at Iquira, Colombia.

The Colombian mines are also very different from those in Peru as far as environmental conditions are concerned. While the Peruvian mines are very dry and dusty due to the arid region, the Colombian mines are very damp. Water runs down through porous rock and hits a gold-containing quartz layer, which
is impervious, and so runs down the layer into the mine. The miners say they look for this because where there’s water, there’s gold.

The mines all have safety systems in place as part of their certification and qualification for the premiums. Each mine has a gas detection and alarm system to protect the workers, along with safe rooms in case of gas leaks or collapses. All mines and processing plants have first aid kits and all workers
have the required personal protective equipment. A number of mines in the cooperative employ women to handle the explosives and do the blasting, as well as work at the mine face.

Figure 20. A safe room in the mine at XXXX

Figure 21. Miners in Colombia
1.

Figure 22. Sacks of ore waiting to be transported to the processing facility.

Figure 23. Sacks of ore in the crusher, Iquira, Colombia.

Once the ore is mined and bagged it is transported to the processing plant. Each bag contains approximately 50kg of ore which is processed in a similar manner to that used at the Peruvian mines, except on a smaller scale. Due to the nature of the deposits, after crushing, a flotation table is used to
separate out the heavier elemental gold and gold-containing particles. They do not use carbon rice but settlement tanks and let the gold rich solutions separate out by gravity before further processing into dore bars. There is a very similar process used at the Coodmilla and Gualconda mines in the Narino
district ‘ crushing followed by flotation table then cyanide treatment.

Figure 24. The flotation table at Gualconda, Colombia.

Figure 25. Gold separated from waste from the settlement tanks.

The Coodmilla cooperative, which is run as a non-profit organization, has been in operation for forty years and has four mine titles of which two have been certified by Fairmined. They have one hundred hectares of land covered by their titles and they are currently only working about three hectares.
Unfortunately, both Coodmilla and Gualconda are currently out of certification, but not due to mining practices. They are having difficulty meeting the new banking requirements outlined earlier. Fairmined is working with them and the Colombian government to resolve this.

Figure 26. A gold bearing quartz vein.

Figure 27. The Gualconda mine, Narino, Colombia.

Both of these mines are remote. Gualconda has been built into the jungle using the natural slope of the hillside to help with their processes. For Gualconda at least it has been a difficult journey up until this stage. Back in 1974 the mine was mined completely using hand tools and mercury, requiring
466 grams of mercury to process one ton of ore. Once used, this waste mercury was discarded directly into the river and therefore into the ecosystem. The mine has made great progress in cleaning up the mercury contaminated sites however there is still evidence of the mercury processing used that requires
cleaning up.

Figure 28. The mercury contaminated site at Gualconda.

Between 2001 and 2006 the mine was shut down due to armed conflict involving paramilitary forces and coca growing. Because of this, about one hundred families were displaced, leaving the area for the local city, but the miners state that life in the city did not suit them. In 2006 they formed their cooperative
but their ASM policy was in its infancy and very poor with regard to processing and environmental care. Between 2009 and 2013 they still did not have power for equipment, so they built a water mill using parts sourced from a junkyard. At this point they were still using mercury but had determined that
to be a responsible ASM source, they needed to phase out the use of mercury altogether. Initially, their policy was to reuse the mercury rather than just discharge it into the river, preventing environmental damage and reducing the quantity required to process one ton of ore from the previous 466 grams
to 25 grams. In 2015 they finally got electricity at the mine and this allowed them to redesign their processing plant, fully eliminating the need for mercury and adopting the more environmentally friendly and safe cyanide-based process that they use today. This gave them an increase of 20% in efficiency,
but also increased costs ‘ cyanide is more expensive than mercury when used to process gold bearing ore. However, the increase in efficiency and the knowledge that with Fairmined certification they would get better prices for their gold, plus a premium, made this process the chosen route to help them
fulfill their desire to be a responsible ASM source. After three years this is just coming to fruition.

The aim of the miners is not to stand still but to improve continuously, which includes decontaminating the remaining area at the mine where mercury was used for processing. This mine is now considered a model for responsible ASM mining and they have tours through every two weeks to see what they have
done and how they have done it. This is all within the backdrop of Colombia still having many social conflicts and corruption ‘ violence and drug trafficking is still prevalent in these areas. It is still the case that many mining titles are given to large mines but the smaller independent mines often
go ignored.

Why should you use responsibly sourced ASM gold?

There are many reasons to buy responsibly sourced and certified ASM gold. It may be a good way to get more customers into your store and so can be good for your business. If your customer base is made up of older generations, introducing a product line using ASM gold can be very attractive to both the
younger jewelry buying consumer and also customers who may not have considered gold jewelry, but making a purchase that makes a difference is attractive to them. There are jewelers who have decided to convert completely to Fairtrade and Fairmined gold, or at least as much as possible, but you don’t
have to do this. Every little bit helps and there’s absolutely no obligation, total conversion of every gold product you make is not necessary. Many jewelers who use ASM gold try one line or one collection to begin with, and if they have success, or the idea shows promise with their customer demographic,
they expand their offerings. The story is there: where it comes from, what the extra money is used for. It’s giving back to developing world c ommunities to improve their quality of life. This fact alone often gives customers a reason to buy jewelry made using ASM gold.

How can you purchase ASM gold?

The best way to find out where to purchase ASM gold is to contact Fairtrade or Fairmined (ARM), which can be done via their respective websites, and they will provide you with a list of suppliers and jewelers who are licensees and registered with them. Both organizations have similar systems: if you
want to use the name and mark, you have to be licensed. Depending on volume of business, you may have to pay to be licensed, undergo an audit, and pay a fee to the organization for every gram sold. If you do not want to use the name or mark, you can still purchase the gold ‘ there are no restrictions
on buying it. In this case you can still call it responsibly sourced gold from artisanal mines, you just can’t call it Fairmined or Fairtrade.

The aim of all businesses is to make money. However, this gold is relatively expensive and so to keep it as attractive as possible to the consumer, when pricing jewelry made from Fairmined and Fairtrade gold, it is advised not to mark-up the premium that has been paid to the mine. To keep the cost of
the piece as low as possible, ask the metal supplier to give you the cost of the gold purchased if it was not Fairtrade or Fairmined. This price can be used to calculate mark-ups and then the cost of the premium added in at the end. The more Fairmined and Fairtrade gold sold, the more money goes to
help improve the lives of miners and the mining communities.

Conclusions.

Where gold is sourced from to make jewelry is a personal choice for the jeweler. Suppliers of gold decide which direction they want to go with ‘ responsible or not – and so jewelers can also decide where and who to buy from. You have a choice. Jewelers who want to take part in the responsible sourcing
initiative can do so. There are three main sources to choose from:

Gold that has been mined responsibly but on an industrial scale. Where there is an audit trail, you know where the gold is coming from and you can inform your customers of this.

Gold that is produced from 100% recycled sources. This source of gold has already paid its environmental mining price, and by choosing this option you are getting, arguably, the most environmentally friendly gold supply by using what is already above ground.

Gold that has been mined responsibly from ASM communities. This choice directly helps developing world mining communities improve both their working conditions, their environment, and their lives in general.

Or, you can choose not to take part – it’s your choice. But consider the following:

  • Being responsible can be good for business.
  • All gold has been mined at some point.
  • The overall aim should be to remove irresponsible mining from our industry.
  • There must be transparency and traceability from mine and/or recycler to retailer.
  • There is still a need for both industry and consumer education.

Finally, is ASM gold any different from any other gold? The answer, of course, has to be no, it isn’t. Gold is gold, wherever it comes from. However, it makes where it came from different, it makes how you get it different, and it makes the environmental and social price it has paid to get to you different.

References:

www.fairmined.org

Photo credit:
www.artisanalgold.org

Photo credit: Marieke Heemskerk

en.wikipedia.org/Mercury_poisoning

www.fairtrade.org.uk

www.responsiblemines.org

Photo credit: Fairmined Family

Continue reading

Direzioni 2020 e innovazione tecnologica per la gioielleria

Paola De Luca

Co-Founder & Creative Director at Trendvisions Jewellery + Forecasting, IEG Italy

Paola De Luca, in 2010, together with Italian Exhibition Group S.p.A. – organizer of VICENZAORO, one of the world’s leading international Jewellery Show – co-founded TRENDVISION Jewellery + Forecasting, an independent observatory focusing on trend forecasting for the jewellery industry where she supports the project as its Creative Director. Starting her career in New York in in 1989, she landed her first job as a designer for Fendi Jewellery and Watches. She later collaborated with leading luxury brands, such as Salvatore Ferragamo, Harry Winston, and Swarovski among other prestigious associations. In 2002, in partnership with CRU Group of London, she established TJF Group Ltd. For a decade, TJF Group focused on research and forecasting, launching the unique “TJF Trend book”, which became the world’s first and most authoritative jewellery trends publication. In 2010 Paola started an exciting collaboration with Rio Tinto Diamonds supporting as Design Director, their global design program. As Creative Director she leads design projects; educational programmes for buyers, government organisations; brands and manufacturers; she coordinates researches think tanks and market trends-focused projects. She is the Founder of The Futurist Ltd., a firm specialised in Forecasting and Creative Intelligence.

DIREZIONI 2020 E INNOVAZIONE TECNOLOGICA PER LA GIOIELLERIA

Scarica la presentazione


Continue reading

Potential and innovation of the selective laser melting technique in the manufacture of platinum jewelery

Potential and innovation of the selective laser melting technique in the manufacture of platinum jewelery

One of the revolutionary characteristics of selective laser melting is the possibility of processing materials that are notoriously difficult to use with other production techniques due to various melting mechanisms and modelling the alloys used in direct 3D metal printing. In the field of precious alloys,
this aspect is particularly interesting in the manufacture of platinum-based jewellery, a notoriously problematic element in the production phase due to its properties which include a high melting temperature of the alloys available on the market today and high reactivity with the materials it comes
into contact with. Consequently, production costs are higher, specific furnaces need to be used and, on average, the items produced often have defects. An assessment of the real revolutionary scope of using the SLM technique in making platinum jewellery was carried out by comparing SLM and traditional
production techniques, not only considering the technical aspects but also, and above all, the impacting economic/financial implications on the production line, in order to understand whether, and to what extent, introducing the SLM technique would lead to improvements in platinum jewellery manufacturing.

INTRODUCTION

In the article presented at the Santa Fè Symposium 2017 (1), we dealt with a general comparison between precious metal micro-casting and direct 3D printing processes (SLM) to understand whether this latter technique was effectively more advantageous than both classic and direct casting.

Among the production cases in which selective laser melting proved to be better, we identified the production of small series, the creation of hollow jewellery or items with complex geometries and no welding, or, when using difficult materials or those that are impossible to use in micro-casting.

Platinum jewellery production could be included in these cases since the casting of this material is famously more difficult than jewellery in gold or silver alloy (3). Moreover, the platinum jewellery market, despite renewed interest in this precious metal in the last 20 years, still has considerably
lower demand than gold or silver jewellery, therefore the machinery is not used to its full productive capacity.

In order to analyse whether, and to what extent, the SLM technique is competitive in relation to micro-casting in platinum jewellery production, we conducted a true-to-life production comparison between the two techniques in collaboration with Progol3D®️, a top reference for selective laser melting,
and Stilnovo S.r.l., a company in San Salvatore Monferrato (Valenza Po’ jewellery district), the producer of OEM jewellery and a reference for platinum casting.

The market segment chosen for comparing the two techniques was wedding and engagement rings since those are the most representative for platinum in the USA and Europe at the moment. The idea of eternal that has always been associated to platinum due to its resistance over time, means that this metal
is particularly in demand for wedding bands. This can be seen, for example, from data regarding the USA market in 2016 where, compared to a 10% drop in the production of platinum jewellery the year before, American spending on platinum engagement rings grew by 5% (2), making this segment even more predominant
than in the past.

WHAT HAS CHANGED COMPARED TO GOLD JEWELLERY PRODUCTION

Producing platinum jewellery with traditional methods notoriously involves more problems than producing items in gold, especially in regard to micro-casting. On the other hand, producing platinum jewellery using the Selective Laser Melting (SLM™) technique is not particularly any more difficult than
making items in gold alloy, which makes this technique interesting for platinum jewellery manufacture. In general, it can be seen that, for metals used in jewellery-making, the more difficult it is to produce with micro-casting, the easier it is to 3D print.

The greatest production difficulty found in micro-casting comes from differences in the thermo-physical properties of platinum alloys compared to gold alloys. First of all, the considerably higher temperature of liquid platinum alloys leads to the use of different heat-resistant materials for making
the moulds to withstand the greater temperatures. Instead of traditional materials based on calcium sulphate and cristobalite, other materials more resistant to high temperatures are required in which silica is blended with phosphate-based binding agents, which requires longer and more strenuous preparation
(4). Coating properties generally vary more drastically compared to traditional heat-resistant materials in the case of imperfect mixing, both in relation to components and processing times, making these materials more sensitive to storing and aging conditions, causing oscillations that are hard to
control in the surface quality and in the mechanical resistance of the cylinders (5).

Even if specific materials are used, cylinder resistance is still critical if they are heated to more than 900°C (6), a limit that leads to a much greater difference in temperature between molten metal and the cylinder during the casting phase compared to gold alloys with the metal consequently losing
heat faster on entry. This effect, together with viscosity and the surface tension of platinum alloys being greater than that of gold alloys, make it more difficult to fill the moulds completely, especially in the narrower areas, and it is therefore necessary to use centrifugal casting machines to partially
alleviate the problem (7). Increasing the centrifugal force helps the metal to fill the mould, but it also increases the chances of refractory fragment detachments which could then be incorporated into the metal when cooling. All these problems limit the quantity of metal that can be used on each tree
to a much lesser amount than can be used with gold or silver alloys, with the consequent reduction in production capacity. Filling problems and greater shrinkage in going from a liquid to a solid state (7) also mean that a more robust feeding system is needed, which, in turn, leads to a more unfavourable
ratio between scrap and pieces produced. A greater quantity of scrap implies higher production costs, which are further increased by the greater cost of refining platinum alloys compared to gold alloys, due to the more complex procedure and verification process. All these additional difficulties make
casting platinum jewellery more susceptible to variable results not to mention the need for more specifically skilled technicians.

The SLM™ process, on the other hand, has no particular problems compared to gold alloy production. In fact, the fundamental properties for metal-laser interaction, first and foremost, reflectivity and thermal conductibility, are more favourable for platinum alloys than for gold or silver alloys. This
means that less energy is required for laser melting and there is no need to add elements to the alloy to favour laser radiation absorption.

QUALITY COMPARISON

The quality comparison between platinum jewellery created through SLM™ and micro-casting was carried out by producing several ring models in Stilnovo’s BRIDAL series, a collection that best incorporates the concept of eternal associated to platinum jewellery since it comprises rings with the MULTISIZE
solution, covered by a patent (Application number 102017000104245, filed on 18 th September 2017).

The multisize patent is a system that leads to a new conception of the ring as an item that can easily change its diameter and therefore always be a perfect fit.

Changing the size of a ring has always been quite a problem for the jeweller as well as for the final wearer. Because a ring is long-lasting, and is sometimes even handed down from mother to daughter, it is quite possible that the need to change the size will arise sooner or later.

The operation is easy enough if the ring only has one mounted ring shank and a centre, but it becomes more and more complicated as shapes develop and is absolutely difficult when the whole shank is mounted: size modification, i.e. making the diameter smaller or larger is, in fact, obtained traditionally
by cutting the shank at the opposite side to the centre and adding or removing some of the metal. When the ring is mounted along the entire surface, it is dangerous to enlarge or tighten it by even just one size because the mounting may become insecure: in fact, changing the curve of the ring inevitably
modifies the diamond or precious stone setting, something with can compromise the reliability of the ring’s “hold” on them.

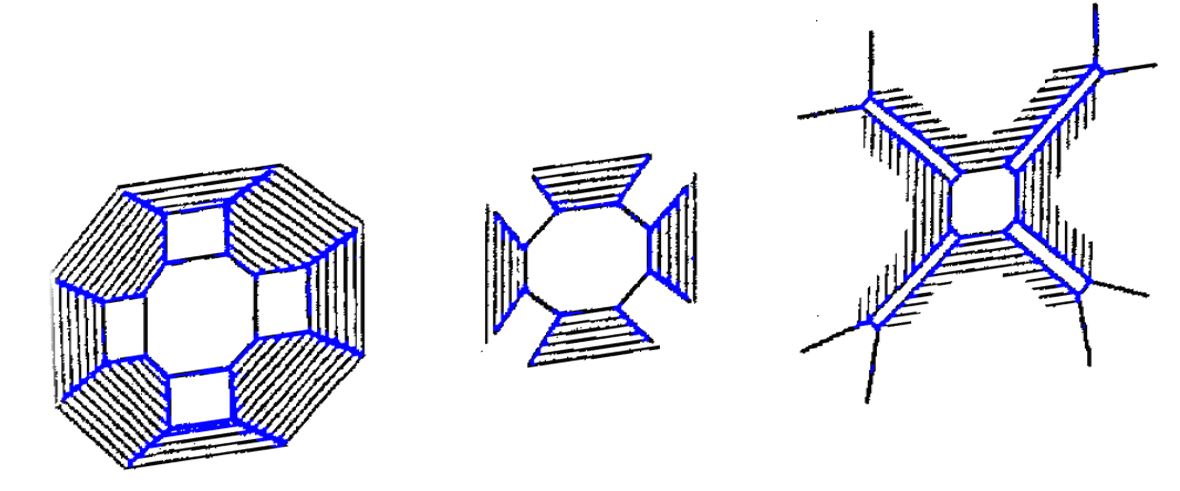
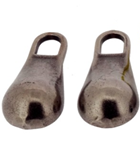
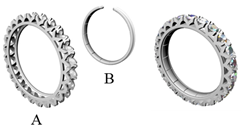
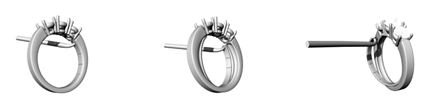
With the MULTISIZE RING solution, the internal part of the ring shank has a slot for an interchangeable B structure in various thicknesses (Figures 1, 2 and 3).

In our study, the A frames were made in platinum, while it was decided to use titanium for the sheet metal.

A simple KEY, a titanium hook, made into the shape of a treble clef, was used to pull out the interchangeable part from its slot in the fixed part when the size needed to be modified. Once the slot track in the fixed part A is empty, it is easy to position a new interchangeable part by hand and change
the size.

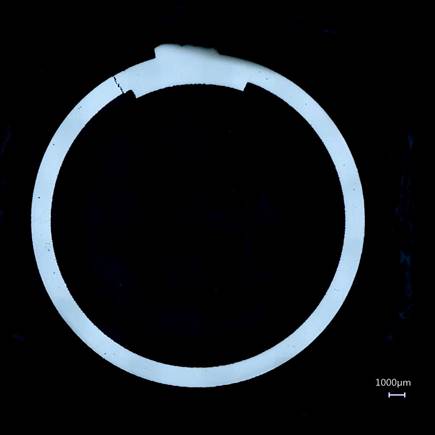
In order to compare micro-casting and direct metal printing, 10 models from the BRIDAL collection were chosen, comprising wedding bands, solitaires and trilogies, whose frames are shown in Figures 4 to 13. Production and the characteristics of the internal interchangeable parts were not taken into consideration
in this study since they were not made in platinum alloy but were preferentially made in gold or titanium due to the mechanical properties needed for the piece of the frame to be repeatedly inserted and removed without becoming deformed.

A wedding band model, called ETERNAL, which features 360° pavè (Figure 14), was initially chosen for the comparison but was later discarded due to the difficulty of removing the support required in SLM™ production.

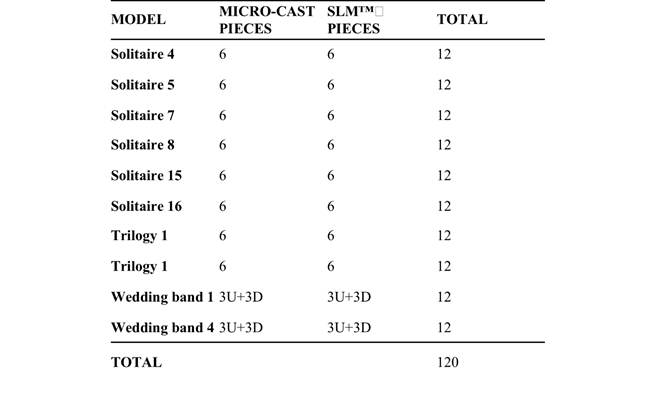
6 rings of each model were made for both production technique in question of which 2 were to be sacrificed for destruction analysis, with the exception of the two wedding band models, of which three men’s size and three women’s size samples were made. The overall total of rings made for the study was
120 pieces of which 40 were to be sacrificed for destruction analysis. The list of pieces produced is summarized in Table 1.

In order to make the comparison more like a real production test, jewellery creation was divided between two producers: Stilnovo for micro-casting and Progol3D® for selective laser melting.  Each of the two producers is specialized in one of the two techniques being tested and is able to optimize the
process to obtain the best possible quality.

To assess quality differences given exclusively from the type of productive course and not ascribable to the different composition of the alloys used, the alloy 95PtGaInCu was used in both SLM™ and in micro-casting. Using the same composition for micro-casting and SLM™ made it possible not to give one
technique an advantage over the other thanks to the relative ease with which platinum can be melted by laser interaction so that no adjustments to the composition were needed for the SLM™ process, which would have been required had gold alloys been used. In fact, this composition is in the Progold range
as a micro-casting alloy and is also in use for SLM production at Progol3D®.

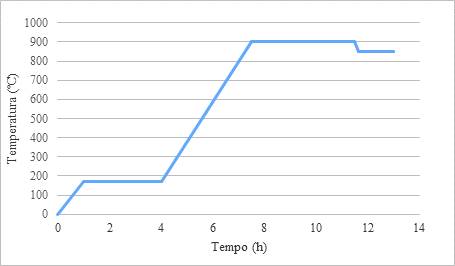
In regard to micro-casting production, the waxes were created with a Projet MJP 2500W 3D printing system using VisiJet M2 Cast wax. The cylinders were prepared with PRO HT Platinum Gold Star® keeping a water/plaster ratio of 33:100. The refractory firing cycle is outlined in Figure 15. Cylinder temperature
during casting was 850°C.

The cylinder plastering and firing phases were grouped as much as possible averaging between minimizing production times and the need to retrieve scrap.

For the melting and cylinder firing process, a Yasui VCC centrifugal casting machine was used with a casting temperature of 250°C above the alloy’s liquid state. After the cylinders were cooled, the refractory residues were removed from the metal by immersing them in hydrofluoric acid at room temperature.

A final sanding was carried out to complete refractory elimination.

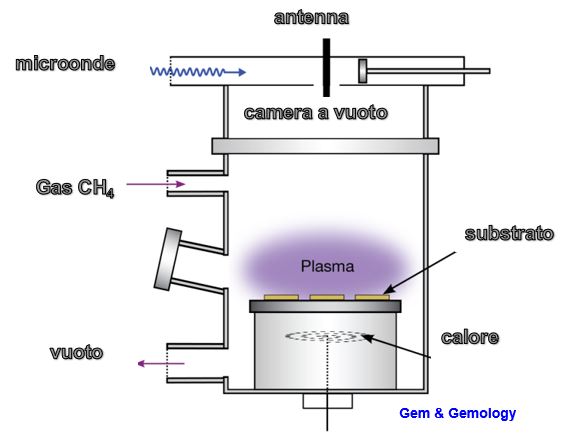
As for selective laser melting, the jewellery was produced using a ReaLizer SLM50 laser printer equipped with a 100W fibre laser, collimated to a ray of 10 μm. The circular construction plate was 70 mm in diameter.

The layer thickness used for printing was 20 μm, favouring printing resolution over production speed, in consideration of the market segment involved in the study.

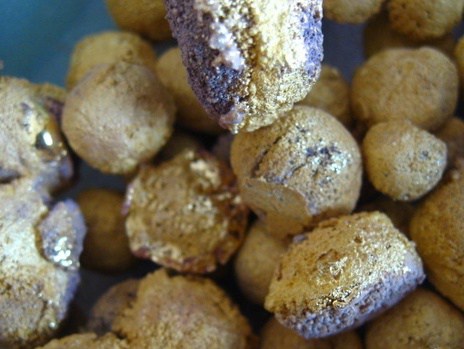
The printer was fed with 95PtGaInCu in powder form, obtained by gas atomization of the alloy and sieving to remove any coarse particles.

The shape of the powder particles was observed under a scanning electron microscope (SEM) and the particle size distribution was determined using a laser granulometer (Malvern, Hydro 2000S).

After the printing phase, the jewellery underwent shot peening to eliminate any partially melted powder on the surfaces which would cause the unrefined pieces to be rougher.

Both in micro-casting and direct metal printing, all the rings were re-fired to solubilize the alloy and reduce the internal tensions by furnace treatment at 1150°C for one hour, followed by rapid cooling in water.  In the case of wedding bands, the pieces were later hardened by furnace treatment at
650°C for an hour with slow cooling.

Whatever the production technique, every ring made was assessed using the following quality standards:

–          Surface appearance “as cast” or “as print”, impact of feed residues and supports.

–          Identification of any macroscopic non-conformity defects.

– Measurement of the internal diameter of the rings, variations to the nominal and deviations in measurements between rings of the same model.

On the two sacrificial samples for each model, the following was also carried out:

–          Measurement of surface roughness in both “as cast” or “as print” and after sanding or shot peening

–          Assessment of the internal quality by trimming and lapping the rings.

All the produced items that were not used for destruction analysis (altogether 40 micro-cast rings and 40 printed rings, subdivided into 10 models) were then polished and eventually mounted at Stilnovo for a final evaluation of the quality. The final quality assessment on the completed item was made
by Stilnovo’s internal quality control department which was not aware of the type of production technique used for each ring to be assessed. The standards normally adopted for high jewellery article control were applied.

At the same time, fundamental data were registered to compare the technological and economical aspects of micro-casting and direct metal printing, such as:

–          Production times

–          Production scrap

–          Technician impressions in the polishing phases

–          Technician impressions on the mounting

In order to correctly collect the data on finishing operations, an evaluation sheet, subdivided by phase, was attached to each ring and each technician was asked to complete it.

EVALUATION OF THE PHYSICAL, MECHANICAL AND TECHNOLOGICAL  CHARACTERISTICS

Surface appearance

The first comparison made between rings produced by micro-casting and by SLM™️ involved the appearance of the surfaces both when raw and after sanding or shot peening. This included assessing the impact on the surfaces of additional elements needed to create the item, in other words, feeders in
the case of micro-casting and supports in the case of SLM™️. The invasiveness and weight of these elements had direct repercussions on the quality of the rings due, for example, to the need to reconstruct the surfaces involved, and economically, because of being directly proportional to the percentage
of production scrap and process times.

This paragraph will evaluate the presence and invasiveness of feeders and supports in terms of the surface extension involved and the residue aspect, while the paragraph on the economic and financial repercussions will report the findings regarding scrap and production times.

Figures 18 to 25 compare the feeding and support systems of the 10 models selected for production.

From the comparison of the additional elements needed in production with the two techniques being examined, it was immediately obvious how the effect on the surfaces was completely different in the two cases. In micro-casting, where additional elements are considerable, the geometry of the directly fed
area of the jewellery item was totally lost, while in SLM™, the geometries below the residues of the supports, built as a grid, were generally visible.

Examples of support and feeding residues on the rings can be seen in Figures 26 and 27.

Support in SLM™ generally involves a greater surface area of the item, but, if the effective area of contact with the supports is taken into consideration, that is, the areas where the grid teeth actually touch the item and spoil the surface, the values are lower compared to the areas affected by feeding
in micro-casting.

There are cases, however, as in the example of the ETERNAL wedding band, in which, although the maximum geometry of the ring is maintained, the loss of detail due to the massive presence of support residue, makes production by selective laser melting, unsuitable.

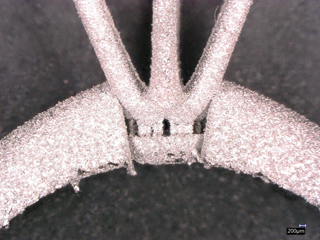
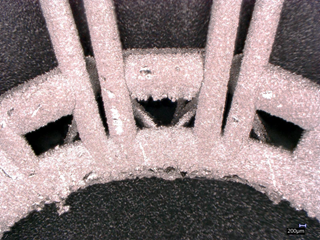
For the solitaire 4 and trilogy 1 models, a good compromise was obtained in SLM™ by using a growth orientation that minimized the corner surfaces so that support was required, but with some supports in areas more difficult to reach than for other models when it came to removing them (Figures 28 and 29).
In these cases, a favourable use of support parameters leads to creating elements that are easier to detach thus partially compensating for the greater dexterity required for their removal.

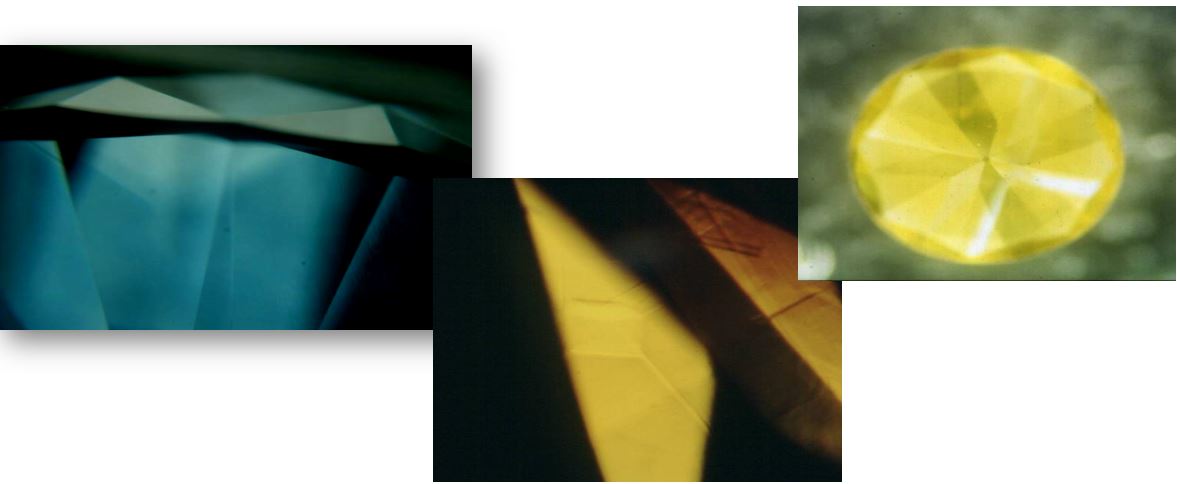
In regard to the overall appearance of the surfaces, micro-cast rings were generally less rough in the raw state (example in Figures 30 and 31) and after surface treatment (Figures 32 and 33). However, surface irregularities were often observed, mainly between all the excess material burrs, which did
not appear with SLM™. These defects will be analysed in more detail in later paragraphs.

Roughness

To provide a quantitative evaluation of the differences between the surfaces, roughness measurements were carried out using a Taylor Hobson FTS INTRA 02 profilometer. The total roughness (Rt) of the profile was chosen as a comparison parameter corresponding to the difference between the highest and lowest
surface points. This value, in fact, represents the thickness of the precious material that must be removed in polishing to obtain an aesthetically satisfactory surface. The values were registered both for the items when raw (“as cast” in the case of micro-casting and “as print” in the case of SLM™)
and after surface sanding or shot peening.

Indeed, raw surface treatment is a production practice at both Progol3D®, by shot peening to reduce roughness and homogenize the surface appearance, and Stilnovo by sanding, mainly to eliminate refractory residues. The actual roughness that the jewellery-maker will come across in the roughing stages
is, in both cases, that of the treated item, and it will be from these values that the quantity of the material to be removed in order to obtain a smooth surface will depend.

Measurements were taken on several areas of the jewellery items corresponding to surfaces with various orientations in respect of the growth direction of SLM pieces and wax growth in micro-casting. Points with no obvious surface defects were measured in order to give an average Rt value net of macroscopic
surface irregularities.

In regard to wedding bands, the growth directions selected for 3D printing, for waxes in micro-casting and metal in SLM™ were the same, shown in Figure 34. Measurements were taken in direction 1 (surface parallel to the growth, direction perpendicular to z), in direction 2 (surface parallel to the growth,
direction parallel to z) and in direction 3 (surface perpendicular to the growth, direction perpendicular to z).

On the other hand, the solitaires and trilogies were printed with a different “standing” in SLM™ than the waxes in micro-casting due to the different type of support used. To be precise, growth was carried out with the pieces directed vertically in SLM™ and horizontally for waxes. In this case, measurement
directions were decided according to the growth direction, as shown in Figure 35 for SLM™ rings and in Figure 36 for micro-cast rings. The direction indicated with 4 therefore corresponds to a parallel surface in the growth direction, with the measurement taken perpendicularly to z, while 5 refers to
a variable surface due to inclination with measurement along z.

Table 2 shows the average values recorded on raw pieces divided by direction with the respective standard deviations, while Table 3 shows the values for items after sanding or shot peening.

The results are summarized in the graph in Figure 37.

As already noted in observing the raw surfaces, the roughness values are clearly greater in SLM™ compared to micro-casting. This is not a surprising result since surface roughness is one of the weak points of the SLM™ technique. In SLM™, the roughness registered is also greater on average than can usually
be found for gold alloys, a finding in line with the values reported in a study conducted by Progold® in 2015 (8), which noted how, compared to gold alloys, the greater presence of partially melted powder particles on the surfaces, leads to higher roughness on the raw item (Figure 38).

The higher degree of roughness registered in SLM™ in direction 3 compared to the other measurements is attributable to the surface progress caused by compounding the melting lines, which give a meniscus effect with greater height in the centre of the line and less height at the edges (Figure 39). In
the wax mould, the meniscus effect is much less pronounced (Figure 40), so much so that the roughness resulting from this effect, measured in direction 3, is much less than that caused by the subdivision into layers on the long z piece, which is the main cause of roughness in other directions.

The standard deviation recorded in SLM™ compared to micro-casting derives from an already higher deviation between different points of the same jewellery item belonging to equivalent areas.  These differences are mainly due to the different surface direction measured in respect of the movement that the
“wiper” makes during platform “recoating” (8), which results in the powder particles adhering differently to the surfaces.

The roughness on the items produced with micro-casting was, however, more constant both on individual items and in consideration of the various models.

Lastly, the effect of surface treatment, whether sanding or shot peening, on the roughness of the pieces in both production methods reduced the roughness values by about half compared to the “as cast” or “as print” condition.

The overall less surface roughness found in micro-casting generally implies that the jewellery-maker will have to remove less material in the roughing stage in order to achieve a compact surface. This is only true, however, if the piece has no areas with excess material, such as burrs, or spaces, like
surface dents. In these cases, the material lost and the processing time can increase considerably.

Defectology

Micro-casting

As already mentioned above, the jewellery items produced by micro-casting had a clearly higher incidence of macroscopic defects than those produced by SLM™, even after casting parameters were optimized.

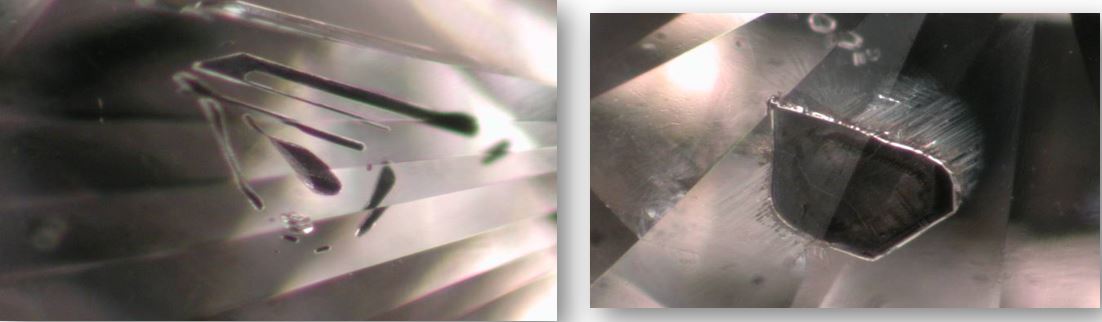
The most commonly found defects were surface irregularities, such as burrs due to excess or lack of material.

In the first case (Figure 41), the cause was the partial rupture of the refractory so that cracks formed where they had filled with metal. This type of defect is generally very simple to correct since the excess material can easily be removed in a short time.

In some models, however, such as trilogy 1, the presence of details separated by tiny spaces, made this type of defect more critical, with cases like the one in Figure 42 where refractory rupture had caused different areas of the item to join up.

Phosphate-based refractory resistance variability, resulting from greater susceptibility to variations in storage conditions and the high temperatures of the casting metal, was the most probable source of other types of defect found.

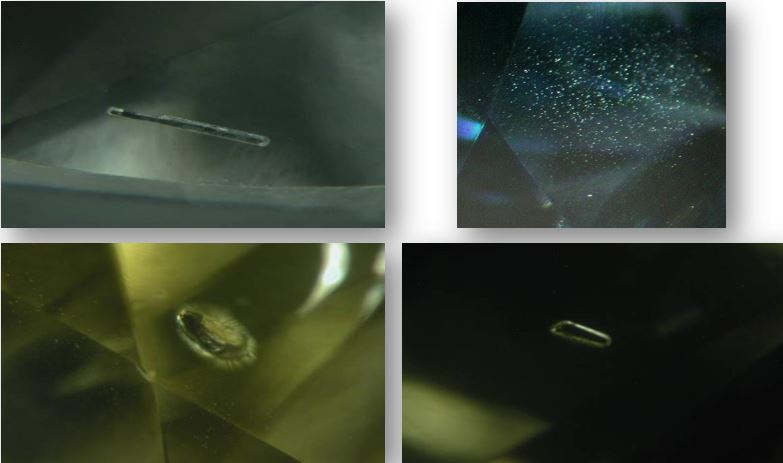
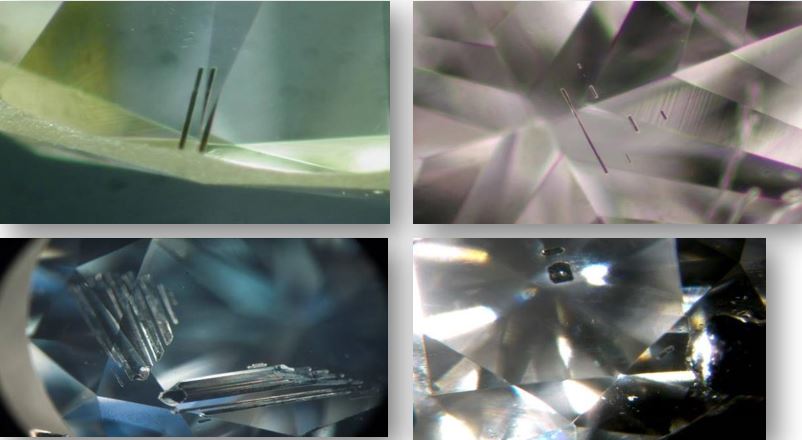
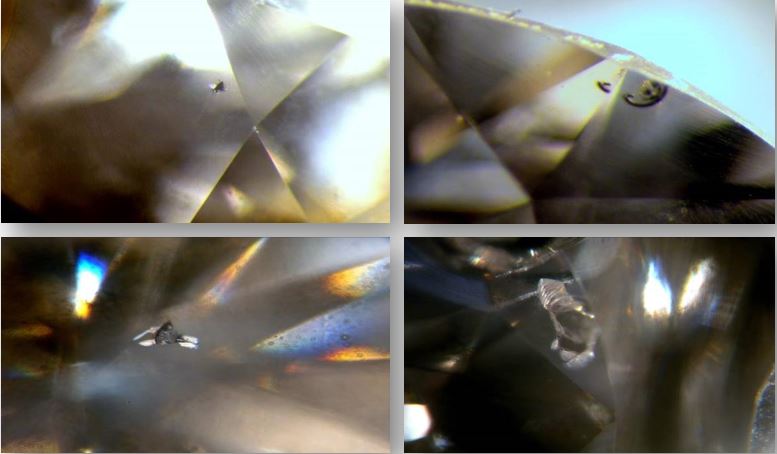
The detachment of tiny portions of refractory led to the appearance of irregularities in some pieces in the form of cavities in cases where these micro-detachments became trapped in the metal (Figures 43 and 44), or of various-sized hollows whenever the micro-detachments were external to the metal and
created tiny round craters on the edges (Figure 45).

The high temperature of the metal, which causes reactions in the refractory, was probably responsible for the irregular surfaces and porosity found in some areas of the micro-cast jewellery items, like those in Figure 46 and in Figure 47, where the roughness was considerably greater than the average
of the surrounding areas.

In other items, surface defects seemed to have been caused by a combination of micro-detachments and refractory reaction (Figures 48 and 49).

The defects shown in Figures 43 to 49 were more damaging for the item compared to the previous since the problem was the lack of material rather than material in excess. In fact, this would have forced the technician to remove more material in order to obtain an even surface or to carry out repairs if
the cavities were deep, with a consequent greater loss of material and longer processing times.

Besides defects ascribable to metal-refractory interaction, problems were also found that derived from other production phases.

For example, the ovalling found in one of the micro-cast model 8 solitaires (Figure 50) was due to probable tension in the waxes or to problems in the plaster casting stage. Although deformed, in these cases, the jewellery-maker can quickly intervene to put the ring back into its original shape, practically
without altering the size so that this defect is of no particular consequence.

Another defect found was bent grips in the models where the grips were particularly long, especially in the model 4 solitaire. This problem (Figure 51), due in all probability to bending the waxes during plastering, can be resolved by adding a terminal ring to stop the grips from moving (Figure 52).

The rupture shown in Figure 53, on the other hand, was attributable to the mechanical stress that occurred in the cylinder cooling stage. In this case the ring was obviously non-compliant.

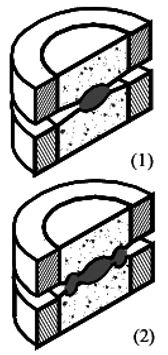
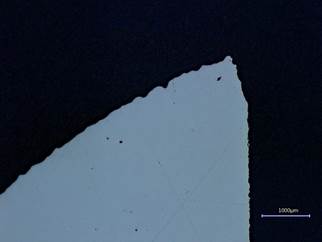
In order to further investigate the causes of rupture, the wedding band was sectioned horizontally and analysed under an electronic microscope.

In the internal part of the ring, where the fracture occurred, a cavity was found which was most likely due to refractory inclusion, given the results of the EDX analysis of the internal residues which highlighted the presence of silicone.

The cavity, which extended to both halves of the sectioned wedding band (Figures 54 and 55), had reduced the effective section of the ring thus drastically lowering the mechanical resistance, therefore the stress caused by the shrinkage in cooling exceeded the ultimate tensile strength causing the ring
to fracture.

SLM™

The macroscopic defects observed in the jewellery items produced with SLM™ were clearly fewer than those found with micro-casting. In fact, while the surfaces had a higher degree of roughness, only in the case of one ring produced was a real irregularity found in the form of swelling in one area of the
piece (Figures 56 and 57).

This type of defect occurs in SLM™ when the powder does not melt perfectly and so some partially non-melted particles remain and disrupt powder distribution in subsequent printing layers.

In this case in particular, since the defect only involved a small part of the item’s upper area, incomplete melting was probably caused by a variation in the average granulometry of the powder in the growth zone, due, for example, to the accumulation of agglomerates of partially molten particles within
the powder distributed by the “wipers” as the printing process continued.

Since the problem was material in excess and not a lack of it, correcting this type of defect was of no particular importance. However, it may happen that the swelling can be associated to widespread porosity in the area concerned, again caused by imperfect melting.

Dimensional coherence

An analysis of the correct nominal size and the deviations that could be found between the various same model rings was carried out on all the items produced by measuring the internal diameter, which can be directly correlated to the actual size of the ring.

For greater precision, the diameters were measured using a calibre (Mitutoyo), averaging three values in different positions, and also by means of photographic analysis using a Keyence digital microscope, suitably calibrated for maximum measurement accuracy.

Table 4 shows the data relating to the internal diameter of the rings. In the averages calculated for micro-casting, the ovalized ring in Figure 50 was not considered due to the difficulty of establishing the real diameter.

From the data obtained, it can be deduced that the internal diameter measurement in relation to the nominal value was always less in SLM™ compared to micro-casting for each of the ring models produced.

The origin of this reduction in internal diameter is obviously different for the two techniques: in SLM, it is caused by an imperfect correction of the width of the single laser trace while in micro-casting, it is caused by refractory shrinkage during the firing stage, from metal shrinkage as it goes
from liquid to solid and from the item’s contraction during cooling at room temperature.

In the case of SLM™, using platinum instead of gold was not a variable that could have affected dimensional variations, while in micro-casting, the higher temperatures and more notable shrinkage during phase change could have been cause for greater discrepancy in the nominal size for platinum rings rather
than gold rings. Repeatability on rings of the same model was generally greater in SLM™, with maximum standard deviations of ± 0.03 mm compared to ± 0.04 mm and more found in some micro-cast models. Given the greater oscillation found in micro-casting, any correction upstream of the internal dimensions,
by altering the design, for example, would be less effective.

Internal porosity

To analyse the porosity inside the items, the first technique considered was computerized tomography, a technique that has the advantage of not being destructive and able to investigate the entire volume of the jewellery item. However, the results obtained were not deemed satisfactory in terms of image
resolution, a problem caused by the high density of platinum which caused such elevated absorption of the beam, that analysing the thickness of the rings was extremely imprecise.

As an alternative to tomography, it was decided to make a direct analysis of the ring sections by cutting two out of the six rings produced for each model. In order to acquire a more complete evaluation of the internal volumes of the rings, sections from different areas of the items were analysed. To
be precise, one ring of the sacrificial pair was sectioned in the A plane represented in Figure 60, while the other was sectioned in the B planes (Figure 61), perpendicular to the first, in four different areas of the ring. After resin incorporation and lapping, the sections were photographed at 50X
to digitally analyse porosity using the software inside the Keyence microscope that had been used to take the images.

Figure 81, while Table 5 shows the percentage porosity values found in the various models considering porosity on the A and B planes of each ring, weighed along the entire surface of each analysed section.

The level of porosity found in the pieces can be quantified as medium-low in both production techniques with lower values in SLM™ compared to micro-casting, which, on average, had a twice as high porosity. For both cases, there was a notable variability between different pieces and between different
areas of the same sample, with sections that had practically total density and others that suffered from higher porosity.

In micro-casting, areas with singular high-volume porosity were observed, like, for example, the cavities in Figure 82, as well as a high number of small porosity clouds, as in the case of shrinkage porosity shown in Figure 83.

The porosity found in SLM™ was not in the form of cavities but single spherical pores (Figure 84), probably caused by gas, or areas with tiny, regularly placed spaces (Figure 85) due to imperfect melting between adjacent laser tracks.

Besides percentage porosity on all the items, locating any pores is also extremely important in jewellery-making: pieces with a dense interior but surface porosity are more difficult to finish than those that are more porous overall but have a more compact surface.

From this point of view, it can be seen how the porosity found in some areas of the SLM™ items was mainly inside the pieces and more rarely on the surface areas. This effect derives directly from the melting modality and item growth. Inside one single “layer”, the external surface is, in face, melted
as one single outer layer and the laser parameters are optimized in order to ensure the almost total absence of porosity in each laser track. The inside is then melted with parallel laser scans. Porosity tends to gather at the joints between the internal scans or between the outer and inner layers,
which are generally at least 150-200 μm from the surfaces, in an area that is unlikely to be removed in the polishing phase. In micro-casting, porosity distribution is more varied: there are surface cavities, visible also macroscopically on the external surfaces and mainly due to tiny refractory
detachments, and shrinkage porosity, which appears to concentrate more inside the items.

Lastly, the case of fracture found in one of the micro-cast wedding bands is to be considered: in this case, porosity, although concentrated inside the ring, was so extensive that it compromised the item’s mechanical endurance.

Metallographic appearance

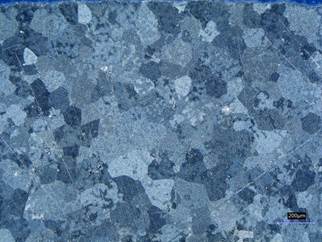
To evaluate the dimension of the crystalline granules in the micro-cast rings and in those printed with SLM™, acid attacks were carried out on model 1 “as cast” and “as print” wedding bands.

Comparison confirmed what had already been seen in the past for samples in gold and platinum alloys: the average size of crystalline granules was drastically greater for micro-cast items (Figures 86 and 87) compared to SLM™ items (Figures 88 and 89). Therefore, in reality, signs of melting traces could
be made out but not of individual granules, even at high magnification.

The SLM™ sample showed the presence of micro-cracks, made visible by the acid (Figure 90). Mechanical tests, reported in the paragraph below, were carried out also to evaluate the effective impact of this defect on the properties of the SLM™ pieces.

Mechanical characteristics

The mechanical characteristics of jewellery, such as hardness, elongation and ultimate tensile strength, have direct repercussions not only on the item’s mechanical resistance but also on technological parameters, such as mounting and polishing.

For this reason, the mechanical performances of the items produced by micro-casting and SLM™ were compared, the alloy used being equal. Micro-hardness tests were carried out on “as print” or “as cast” model 1 wedding bands, both after re-firing (1 hour at 1150°C) and after hardening (1 hour at 650°C),
using a Vickers FUTURE-TECH hardness tester. The ultimate tensile strength (UTS) and elongation (A %) values were, on the other hand, obtained from traction tests carried out with an INSTRON dynamometer on specifically created specimens, shown in Figure… In this case the values were measures on “as
cast” or “as print” specimens and on specimens subjected to re-firing treatment, to evaluate possible mechanical differences that may affect the mounting phase.

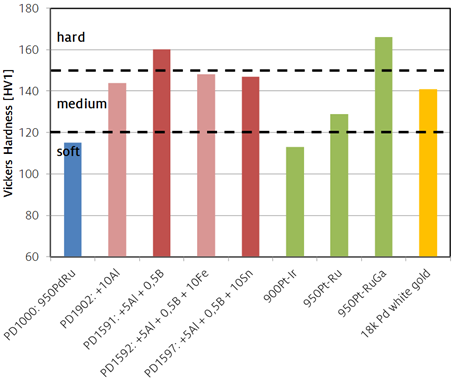
The greater hardness found for “as print” items compared to “as cast” ones was more than likely due to the smaller dimensions of the crystalline granule in SLM™ and to higher internal tensions in printed items. The re-firing treatment, which, in the case of the alloy used, had the double effect of lowering
the samples’ internal tensions and of solubilizing, meant that, in both cases, hardness could be lowered to below 190 HV, therefore making mounting possible. After aging, in both cases, hardness increased considerably, although it was greater for micro-cast pieces, for which resistance to wear and tear
could therefore be greater than for SLM™ pieces. The difference observed could be caused by the presence of the micro-cracks seen in the SLM™ wedding bands when tested with acid, which favours indenter penetration into the sample.

In regard to traction tests, the samples printed by SLM™ had a greater ultimate tensile strength in the “as print” state than the “as cast” samples, to the expense, however, of lower ductility.

After the re-firing treatment, the ultimate tensile strength lowered for both types of sample but was still higher in the case of SLM™. The results of elongation at fracture, on the other hand, show an inversion between SLM™ and micro-casting. In fact, although ductility increased with thermal treatment
in both cases, the increase in SLM™ was considerably greater.

After re-firing, the samples produced by SLM™ therefore had higher UTS and elongation at fracture values, a fact that indicates how the micro-cracks observed after metallographic attack on printed samples can probably be attributed to mechanical properties rather than granule size and to possible internal
defects in the micro-cast samples.  Better performances after re-firing suggest a better behaviour of items during mounting.

Finishing: technician impressions

The impressions of sector technicians play a fundamental role in the possible success of a new production technique. Jewellery production is not exempt from this rule: even though the quality of a product may seem to be excellent according to technical analysis, if, during the processing phases, it does
not ‘convince’ the workers, with all probability, the production technique will not be adopted in the future. For this reason, we considered it essential to collect the opinions of the “jewellery makers” involved in item finishing in order to be able to add more subjective, but equally important to
the overall assessment of a new production method, evaluations to the quantitative ones, like times and losses due to finishing. The 80 rings created and not subject to destructive tests, were therefore sent for finishing and evaluation. Each of the working phases was carried out by the same technician
both for items created by micro-casting and by SLM™ in order to have the same judgment gauge for both techniques.

The first phase of the finishing process is eliminating any added element residues from the rings that were used in their production but which are not part of the item, i.e. feeders in micro-casting and supports in selective laser melting. As can be seen by the opinions expressed, summarized in Figure
87, from this point of view, the SLM™ technique suffered from some models having supports that were more complicated to remove, like those used for the model 4 solitaire in Figure 28 and in the model 1 trilogy in Figure 29. Removing supports from the internal areas of the item required greater dexterity
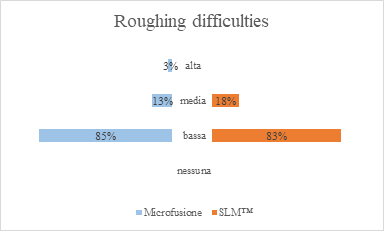
on the part of the technician and increased the probability of the item being spoiled in this phase. Substantially similar results were observed in evaluating the difficulty of roughing (Figure 90). In fact, opinions generally regarding the roughness and compactness of the item’s surface revealed that
rings produced by SLM were 80% less difficult to work than those made by micro-casting. The only significant difference was the presence of a non-compliant micro-cast ring identified in this phase, which had caused particular roughing difficulties before it was definitively put aside.  The results obtained
with this evaluation are particularly interesting if one considers that one of the weak points of selective laser melting is high surface roughness.

The impressions reported by technicians on this point revealed that, at least in the case of platinum, all that was needed was slightly greater pressure or thicker paper during this preliminary phase to eliminate the additional surface roughness with little additional effort compared to micro-cast pieces.

This extra effort was, however, amply compensated by the quality of the SLM metal that the technician found (Figure 94): the percentage of surfaces evaluated as excellent in SLM™ in terms of compactness was, in fact, close to 100%, while in micro-casting, evaluations were more varied with only about
60% of surfaces considered as excellent, 25% as average, 10% as low quality due to evident porosity, and two rings were judged as non-compliant.

No particular difference was observed in the cleaning phases (Figure 95), while in mounting, the overall evaluations in both cases went from low to none (Figure 96). The mechanical properties of the metal therefore resulted as more than good both for the micro-cast alloy and the printed alloy.

Quality Control: evaluation

The Quality Control judgment is fundamental for understanding if the jewellery items produced conform to residual porosity criteria and the aesthetics defined by high jewellery.    We therefore subdivided the rings into those that directly passed verification, those that needed quick laser repairs in
order to be compliant and those that were judged as non-repairable.

There was considerable diversity in the results obtained in SLM™ and in micro-casting: while three quarters of the printed rings immediately passed the checks, only half of those produced by micro-casting achieved the same result (Figure 97).

The judgments expressed by Quality Control confirmed the data obtained from analysing the macroscopic defects and internal porosity of the sacrificed samples: the items produced in platinum by SLM™ were immediately found to be less faulty than those produced by micro-casting.

In regard to non-compliances, no SLM™ item was found to be such compared to two items made through micro-casting and submitted for finishing. Furthermore, one sacrificial wedding band was found to be non-compliant due to breakage.

The final appearance of the ten ring models after mounting and polishing can be seen in Figures 98, 99 and 100 for micro-casting and in Figures 101, 102 and 103 for 3D printing.

ECONOMIC AND FINANCIAL ASSESSMENT

Semi-processed production times

Both micro-casting and selective laser melting production processes were organized to reflect the timing and subdivision into typical phases of real-life production. Micro-casting production was subdivided onto 11 trees, listed in Table 8. Cylinder firing cycles, which are the longest production phase
for micro-casting, were grouped in order to obtain the best compromise between production times and scrap recovery. In order to imitate what happens in real production, it was, in fact, decided to re-use the casting scrap, adding it to new alloy to compensate the percentage of material used for producing
authentic jewellery. This procedure is normally carried out to limit the quantity of precious metal needed, both because of the cost of the raw material itself and for the cost of refining the scrap. To be precise, new alloy was used for the first group of four trees while the scrap added to new alloy
to reach the weight of the tree to be cast, was used for the next three trees and the last four.

In SLM™, production was distributed over 7 printing plates (Table 9), created in descending order according to the height of the items to be produced. In fact, this optimizes the use of the powder by producing the highest items first for which the quantity of powder needed to fill the printing space
is greater.

The average times for each cylinder and the total times that the machinery was in use, subdivided by phase, are shown in Table 10 for micro-casting. Table 11, on the other hand, shows the average times for each printed plate and the total times that the machinery was in use, subdivided by phase, for
SLM™. The time it took the technicians to carry out production was also recorded. In fact, a higher total of man hours not only increases production costs, it also implies less possibility of having an automated production process.

From the data shown, it can be noted how machinery usage times are lower (-20%) in micro-casting compared to direct metal printing. In both cases, one production phase required a longer usage of machinery compared to the others: in micro-casting, firing the plaster casts took 55% of the total production
time, while in SLM™, the printing phase actually took 85% of the overall time. Both phases, however, do not require any intervention from technicians and only weigh on production costs in terms of machinery usage and electricity.

Looking at man hours however, the situation is the opposite: despite the longer machinery times, the SLM™ technique required less technician time than micro-casting (-20%), and is therefore more inclined towards automation.

Another important fact for evaluating a production technique is undoubtedly the total production time, considered as the actual time it took to create a jewellery lot. This timing takes into account the effective daily hours (8 hours subdivided into two groups of 4 with a 1-hour break in between), the
weekly working days (5) and which processes can continue during the night because no human supervision is required. Also taken into consideration are processes that can be done at the same time as well as any waiting times, such as the time needed for pickling in acid or for partially drying the cylinders,
which do not involve machinery or technicians, but are part of the production process all the same.

The time divisions for micro-casting and SLM production phases are shown in Tables 12 and 13 respectively, considering the production sequence actually used for making rings. This includes subdividing micro-casting into 3 groups of cylinders in order to be able to use less precious material by re-casting
scrap, and the creation of 3 SLM™ plates with the lowest last instead of inserting them with the others to save time, in order to be able to use less powder in the machine at the beginning.

The total production time was equal to 5 working days for micro-casting and 5.5 for SLM™, which was therefore slightly slower. It should, however, be considered that the operations done on the sixth day in SLM™ do not prevent starting the production of a second lot because they can be done at the same
time. This means that, in the case of consecutive lots, the production capacity of 60 rings, equal to those made for this study, with the subdivision between phases, can be considered the same in the two cases.

Finishing times

The overall finishing times are shown separately in terms of semi-processed production times because the finishing needed the same phases for the items made with micro-casting as those made with SLM™. The discriminating factor in this phase was therefore the ease with which residues from feeders and
supports could be removed and the quality of the items in terms of surface roughness and compactness and of residue porosity. In fact, generally speaking, external porous surfaces or particularly irregular surfaces force the technician to remove more material in order to reach more compact areas of
the item with the consequent increase in working times and finishing loss.

After analysing the times needed to remove feeder and support residues, it can be noted that the former, on average, was done faster given also the relative simplicity of the ring geometries in the fed areas. The average time required in this phase was also more homogenous in micro-casting, while in
SLM™, variability grew depending on the positioning of the supports with longer times required for models where technicians indicated residue removal as more complex on their work difficulty evaluation sheet.

However, observing roughing times, it appears that, except for a few cases, the rings produced with SLM™ required similar or even shorter working times than those produced by micro-casting. This fact agrees with the impressions on the complexity of this phase shown in Figure 93 which, on average, saw
SLM™ rings as easy to work as the micro-cast ones but with a better surface quality. Polishing phases did not reveal any substantial differences between the techniques even in terms of working times and the same can be said for mounting, with the exception of the model 4 solitaire, which recorded a
slightly longer time with micro-casting.

Repairs, needed to a greater extent on micro-cast items but which were of short duration, led to a slighter longer overall time for micro-cast jewellery.

Finishing loss

The material removed from the rings in the finishing phases has an immediate effect on production costs since it cannot be totally recovered by refining materials that come from processing. To calculate these costs, an average loss of 5% of precious metal from finishing was estimated. Table 16 shows
the average values for losses for each model and for each technique during all the finishing operations.

The overall losses were greater in SLM™ or in micro-casting, depending on the model being processed. Analysing the individual phases, it can however be noted that, in the feeder elimination phases, micro-casting had greater losses than SLM™, while in the roughing phases, selective laser melting always
lost more material. These results can be easily explained by the greater quantity of surface roughness in SLM™ in the latter case. The impact of the losses recorded in terms of production costs, assuming a loss of 5% in the polishing recovering phase, is summarized in Table 17.

Raw material production costs

For a correct evaluation of the final cost of the items, we also considered the differences in the raw material costs. In fact, the two production methods differ in terms of the price of the raw material and the number of refining actions required to make the same quantity of jewellery. In regard to
raw material costs, we estimated, by evaluating the market prices, a higher amount for buying ‘new’ raw materials of 0.3 €/g for the powder needed in the SLM™ process compared to the micro-casting alloy, due to the cost of atomization. The same cost difference was taken into consideration between the
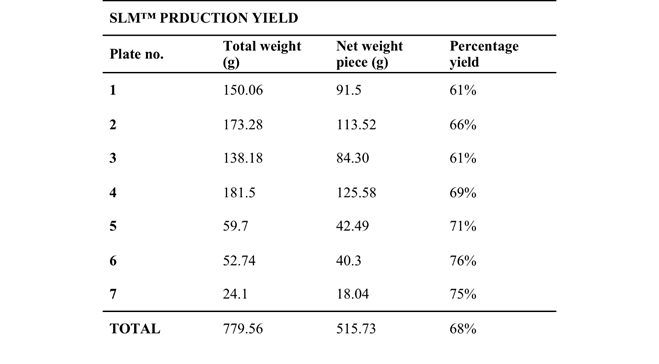
breaking down and atomization of new raw material retrieved from refined platinum. In order to assess the impact of refining, the first calculation regarded the various yields of the two production processes in terms of the ratio between pieces produced and casting scrap. The weights recorded and percentage
production yields are listed in Table 18 for micro-casting and Table 19 for selective laser melting.

The different yields found in the two production processes had a direct repercussion on the refining needed in the two cases with the consequent effect on production costs.  The calculation of production costs due to refining was carried out assuming that:

the 60 rings produced for this study represented a typical production lot, equal to about 500g of raw jewellery. To make the 60 micro-cast rings for this study, production scrap was re-cast twice, starting from 1 Kg of the initial alloy. We considered that we would have to refine everything after one
production lot.

To consider a situation in SLM™ similar to that of micro-casting, we assumed that, also in this case, everything would need to be refined after having re-melted the scrap twice. Moreover, for this study, the printer was initially loaded with 2.8 kg of powder, a standard production condition.

Refining costs, both fixed and those that depend on the quantity of material, were calculated using the average of the prices applied by 6 different Italian market suppliers (Table 20).

Focusing on SLM™, the quantity of powder that was initially put into the printer to produce jewellery lots was 2.8 kg. When creating one single lot, no scrap needed to be re-melted and, at the end of the print, the quantity of powder still in the machine was about 2 Kg, the rest having been used to produce
the items (500g) and supports (300g approx.). The second lot was also created without re-melting while, in order to make a third production lot, the scrap (mainly from supports) needed to be re-melted and 1000g of new powder had to be added in order to fill the printing platform to cover the height
of the items to be printed. Re-melting the material twice was only required to produce a fifth lot and, only after the sixth lot did all the powder need to be refined. In order to start producing a seventh lot, 1000g of new powder had to be added to that made with refined material.

The data relating to the powder needed for production by SLM™ and the material to be refined are shown in Table 21 while Table 22 reports the relative costs.

As a comparison, the refining costs for 3 Kg of jewellery produced with micro-casting were calculated, bearing in mind that, after every 500g lot, about 0.5 Kg of scrap would need to be refined (Tables 23 and 24).

Despite the lower raw material costs, the cost per gram of jewellery produced was 7% higher in the case of micro-casting mainly due to the set amounts for each refining, which mainly corresponded to the costs for the concentration sample. These expenses were, of course, to be added to the hours of machinery
usage, man hours and energy consumptions in order to have a complete picture of the effective cost per gram of jewellery produced with the two techniques in question.

Total production costs of the rings

With the data presented in the previous paragraphs, including production times, production lots and yields, the final industrial costs for producing each individual model could be calculated. In order to do so and to make the comparison as close to reality as possible, the following assumptions were
made:

Production capacity was calculated for the two techniques based on the effective use of both systems, considering the ring lot made for this study as a quantity produced in a week.

We considered a total machinery amortization time of five years, taking into account the current average fiscal amortization period in Italy. We did not consider the potential duration of the systems in work hours because all the machinery will most probably become obsolete before the end of its lifecycle.

The costs linked to consumer materials were divided uniformly between the items made, calculating an average cost and not the specific cost of each item produced.

In the calculation hypothesis, we intentionally left out the physical space needed to carry out industrial activities which, in regard to 3D printing, are decidedly smaller than that taken up by a lost wax casting system. The same goes for the capital invested into the electrical and hydraulic systems
needed for micro-casting.

We also did not take into consideration any waste disposal costs (crucibles, plaster, acids, etc.)  deriving from the lost wax casting process.

We also lowered the benchmark by considering two hypothetical companies that exclusively produce items in platinum. This would mean lower exploitation of resources, which could be common to platinum, gold and silver processes.

Dividing machinery usage and human resource costs for each model was carried out based on the percentage weight of each ring produced in respect of the total cylinder cast or the print plate.

The hourly cost of the technicians was taken as the same for both SLM™ and micro-casting, and similar for each person involved in the production and finishing processes.

The consumer materials needed for SLM™ and micro-casting production are listed in Table 25.

The results of production cost calculations for each model were subdivided into semi-processed production costs, finishing costs (including losses of material during processing) and refining costs, shown respectively in Tables 26, 27 and 28.

What emerged from semi-processed production costs was the enormous impact of micro-casting system underuse which led to unfavourable amortization costs compared to the SLM™ technique. This resulted in a higher production cost for almost every ring model, with the exception of the wedding bands for men

System underuse is due to the widespread practice in many companies of internalizing the platinum casting phase mainly for strategic rather than economic reasons, preferring not to entrust the process to third parties. Moreover, the platinum jewellery segment is a precious metal jewellery niche with
production demand standing at about 60 times less than demand for gold, another element that contributes to not optimising the use of the machinery.

The overall finishing costs, however, showed a more varied trend with a general advantage for the SLM™ technique except for those items that involved greater difficulty in removing supports and in roughing.

In regard to refining costs, all the models resulted more favourable with SLM™ due to the higher cost per gram for micro-cast jewellery.

Lastly, looking at the overall costs (Table 29), SLM™ production was clearly less expensive compared to micro-casting in 5 solitaire models and for the ladies’ wedding band sizes, while trilogy 1 and wedding band 4 for men were less expensive in micro-casting. Finally, in three cases, the model 8 solitaire,
model 2 trilogy and wedding band 1 for men, the costs were practically identical, given that the differences found could easily be cancelled out by tiny variations in the production phases. It should also be underlined that, the additional cost linked to re-firing two non-compliant, micro-cast wedding
bands was not taken into consideration in the calculations, therefore only 57 out of the 60 micro-cast rings were truly suitable for sale compared to all 60 in SLM™.

Investment capital

The amount of investment capital required to start producing the semi-processed goods involved in this comparison, net of the necessary resources for the finishing phases, which are the same for micro-casting and SLM™, are slightly higher for SLM™. In fact, the greater quantity of machinery needed to
start micro-casting activities is only partially compensated by the high cost of a selective laser melting printer and by the need for more precious material, estimated as 2.8 Kg of powder against 1 Kg of alloy in micro-casting, to be able to print the jewellery items to their full height.

It is also true that, in the case of micro-casting, there is a better offer of machinery which could lead to a lower amount of investment capital, while in 3D printing, the investment capital calculated here is the minimum required for using this technique. Another difference is that the investment capital
for micro-casting is all instrumental while part of the capital in 3D printing is financial. This favours an SLM™ company in the case of liquidation since selling precious metal is easier than selling second-hand machinery.

It should be noted, however, that, as previously mentioned, we did not take into consideration the higher cost of the systems needed for the good working order of micro-casting machinery, which include a more complex electricity system, a hydraulic system that must be installed onto each machine with
chilled water and a vacuum system to convey the air and dispose of fumes during cylinder firing phases.

It should also be added that a lost wax casting system requires a working space of at least 50 m² which, at market price in Italy, would cost about 100,000 €, while the space need for 3D printing is potentially less than 1 m².

Environmental impact

The environmental impact is a standard that is becoming increasingly important in the overall assessment of a production process. For this comparative study, environmental impact was quantified for each production technique by calculating the Carbon Footprint (CF), which refers to the amount of greenhouse
gas (GHG) released during production, expressed in terms of CO2 equivalent mass.

The released GHG comparison was carried out considering all the phases and materials needed to complete jewellery production. Calculation of emissions caused by production and by disposing of the materials used was carried out using the data taken from the EcoInvent 2.2 database, while the data on greenhouse
gases deriving from the production of electricity to power the machinery were taken from the National System for Environmental Protection ((ISPRA), based on the production of electricity for the Italian network (9). Calculations did not include greenhouse gases caused by raw material extraction and
system and machinery construction.

It can be noted from the results how the total of greenhouse gases released into the environment during the production of 60 rings with SLM™ was half the amount generated with micro-casting. Greater electricity consumption, the gases released in plaster firing phases and the general use of materials
with a high environmental impact are the main cause of this result.

CONCLUSIONS

We can conclude from this study that, from a qualitative point of view, the jewellery produced with SLM™ is better both in terms of macro surface defects and internal porosity. This fact is confirmed by technician evaluation and the number of items that needed to be corrected by laser, as well as by
the lack of non-conformities compared to the three non-compliant wedding bands produced by micro-casting. The potential re-firing of a non-compliant piece is also more unfavourable in terms of time and costs compared to a hypothetical re-print.

Production times were slightly slower in SLM™, although the technique is more effectively exploited with small platinum production lots compared to a micro-casting system.  The greater production yield with selective laser melting also limits resorting to refining, with advantages on costs.

The overall costs were significantly in favour of the SLM™ technique for many of the models created, with only two evident advantageous cases in micro-casting. All this in the face of a slightly higher initial activity start-up investment and half the environmental impact.

In consideration of the data collected, we can conclude that, for companies that deal only in platinum productions and with weekly lots of about 500g of raw jewellery, the SLM™ technique is decidedly more advantageous than micro-casting, since it is more suitable for the small quantities of platinum
jewellery produced and has, on average, a better quality compared to the same items produced by micro-casting.

We can therefore confirm that, as our work presented at the Santa Fè Symposium 2017 hypothesized, platinum jewellery production can be included in cases in which the SLM™ technique is truly an added value compared to traditional casting.

References

Damiano Zito et al., “Why Should We Direct 3D Print Jewelry? A Comparison between Two Thoughts: Today and Tomorrow,”
The Santa Fe Symposium on Jewelry Manufacturing Technology 2017, ed. E. Bell et al. (Albuquerque: Met-Chem Research, Inc., 2017).

Teresa Fryé and Joerg Fischer-Buehner, “Platinum Alloys in the 21st Century: A Comparative Study,”
The Santa Fe Symposium on Jewelry Manufacturing Technology 2011, ed. E. Bell (Albuquerque: Met-Chem Research, Inc., 2011).

GFMS Platinum Group Metals Survey 2017, Thomson Reuters Eikon™.

G. Ainsley et al., “Platinum Investment Casting Alloys,”
Platinum Metals Review
22, no. 3 (London: Johnson Matthey & Co. Limited, July 1978): 78.

P. Lester et al., “The Effect of Different Investment Powders and Flask Temperatures on the Casting of Pt Alloys,”
The Santa Fe Symposium on Jewelry Manufacturing Technology 2002, ed. E. Bell (Albuquerque: Met-Chem Research, Inc., 2002): 321-334.

U.E. Klotz and T. Drago, “The Role of Process Parameters in Platinum Casting,”
The Santa Fe Symposium on Jewelry Manufacturing Technology 2010, ed. E. Bell (Albuquerque: Met-Chem Research, Inc., 2002): 287-326.

Damiano Zito et al., “Definition and Solidity of Gold and Platinum Jewelry Produced Using Selective Laser Melting (SLM™ ) Technology,”
The Santa Fe Symposium on Jewelry Manufacturing Technology 2015, ed. E. Bell et al. (Albuquerque: Met-Chem Research, Inc., 2015): 455-492.

Istituto Superiore per la Protezione Ambientale, “Fattori di Emissione Atmosferica di CO
2 e Sviluppo delle Fonti rinnovabili nel settore elettrico”, (2017).


Figure


1


. Eternal model frame and interchangeable part


Figure


2


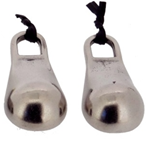
. “KEY” for replacing the spring


Figure


3


. Sequence for changing the interchangeable part on Trilogy


Figure


4


. Model 1 wedding band frame


Figure


5


. Model 4 wedding band frame


Figure


6


. Model 4 solitaire frame


Figure


7


. Model 5 solitaire frame


Figure


8


. Model 7 solitaire frame


Figure


9


. Model 8 solitaire frame


Figure


10


. Model 15 solitaire frame


Figure


11


. Model 16 solitaire frame


Figure


12


. Model 1 trilogy frame


Figure


13


. Model 2 trilogy frame


Figure


14


. ETERNAL model wedding band


frame


Figure


15


. plaster firing cycles


Figure


16


. Feeders and supports used to produce the model 1 wedding band


Figure


17


. Feeders and supports used to produce the model 4 wedding band


Figure


18


. Feeders and supports used to produce the model 4 solitaire ring


Figure


19


. Feeders and supports used to produce the model 5 solitaire ring


Figure 20 . Feeders and supports used to produce the model 7 solitaire ring


Figure 21 . Feeders and supports used to produce the model 8 solitaire ring


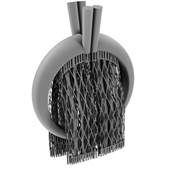
Figure 22 . Feeders and supports used to produce the model 15 solitaire ring


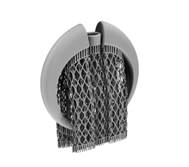
Figure 23 . Feeders and supports used to produce the model 16 solitaire ring


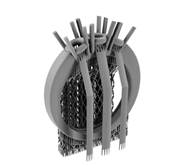
Figure 24 . Feeders and supports used to produce the model 1 trilogy ring


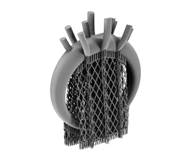
Figure 25 . Feeders and supports to produce the model 2 trilogy ring

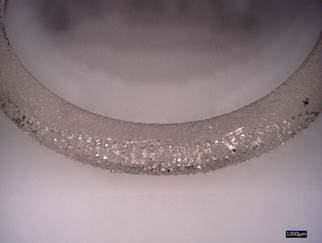
Figure 26 . SLM™ support residue on the surface of a ring

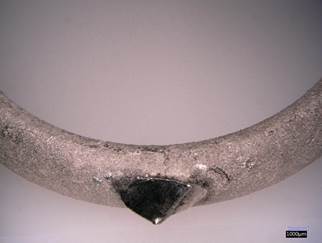
Figure 27 . Feeder residue on the surface of a ring


Figure


28


. Internal support in the model 4 solitaire


Figure


29


. internal support in the model 2 trilogy

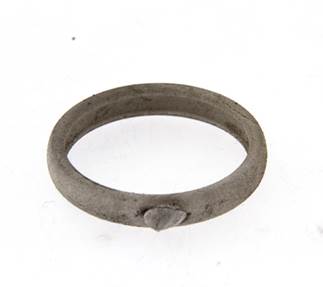
Figure 30 . Raw model 4 wedding band produced by micro-casting

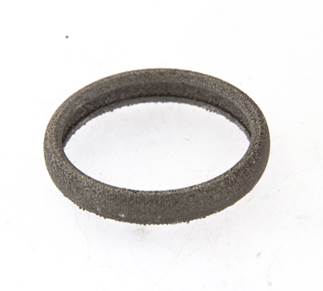
Figure 31 . Raw model 4 wedding band produced by SLM™

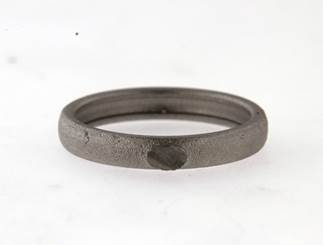
Figure 32 . Model 4 wedding band produced by micro-casting, after sanding

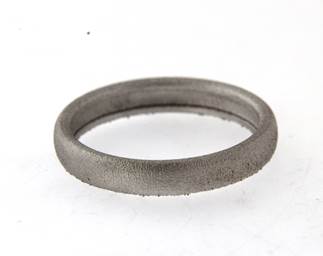
Figure 33 . Model 4 wedding band produced by SLM ™, after shot peening

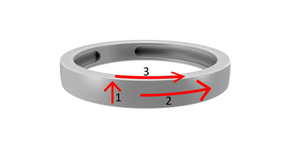
Figure 34 . Roughness measurement directions on wedding bands

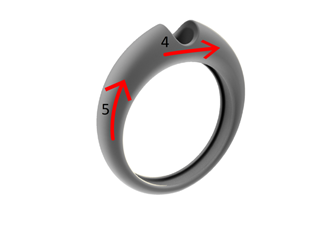
Figure 35 . Roughness measurement directions on SLM™ solitaires and trilogies

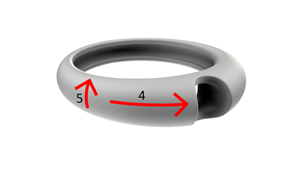
Figure 36 . Roughness measurement directions on micro-cast solitaires and trilogies

Figure 37 . Average roughness found in the various directions in micro-casting and SLM ™

Figure 38 . Surface roughness on the vertical wall of a raw SLM™ wedding band, 300X

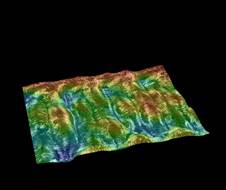
Figure 39 . Surface roughness on the horizontal wall of a raw SLM™ wedding band, 300X.

The parallel tracks left by the laser scans can be seen.

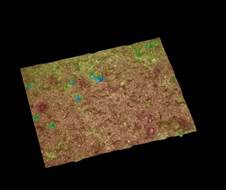
Figure 40 . Surface roughness on the horizontal wall of a raw micro-cast wedding band, 300X.

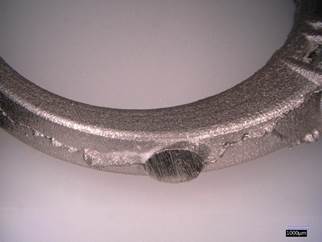
Figure 41 . Excess material on the side of a micro-cast ring

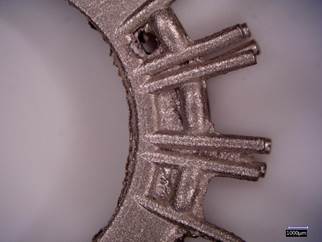
Figure 42 . Example of refractory breakage

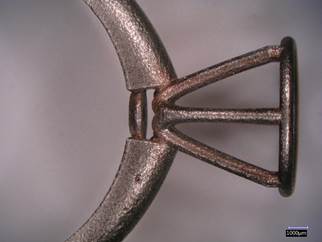
Figure 43 . Cavity on the surface of a model 4 solitaire, probably caused by a refractory micro-detachment encased in the molten metal

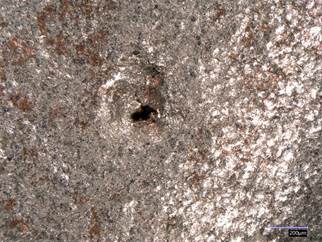
Figure 44 . enlargment of the defect in Figure 43

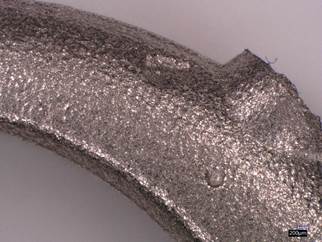
Figure 45 . Subsidence probably caused by fragments of detached refractory stuck on the surface of the molten metal
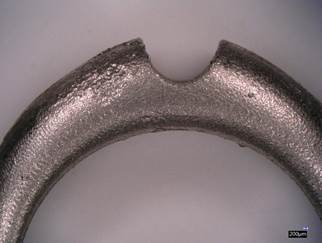
Figure 46 .

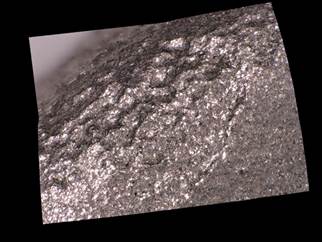
Figure 47 . Details of the surface in Figure 46

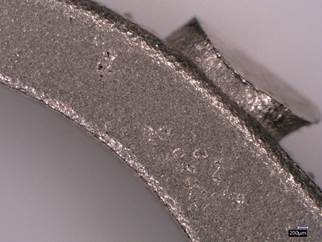
Figure 48 . Surface porosity in a micro-cast solitaire

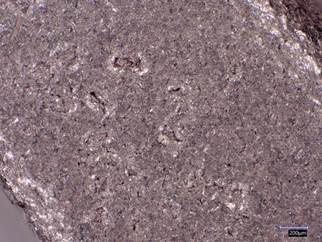
Figure 49 . Details of the area in Figure 48

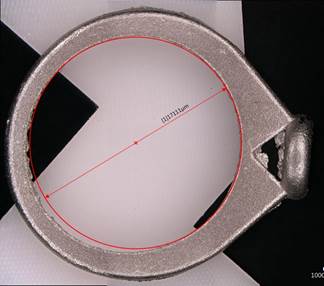
Figure 50 . Micro-cast model 8 solitaire with evident ovalling

Figure 51 . Deformation of the grips of a micro-cast model 4 solitaire

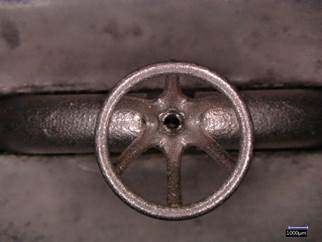
Figure 52 . Added ring to stabilize the position of the grips on model 4 micro-cast solitaires

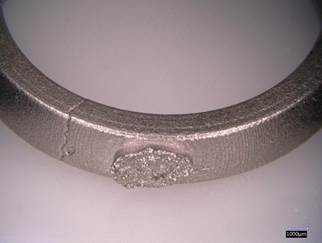
Figure 53 . Breakage in one of the micro-cast wedding bands

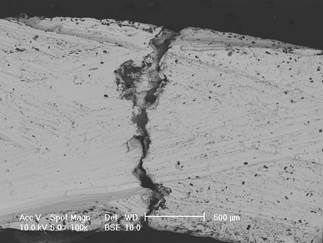
Figure 54 . Internal cavity in a micro-cast wedding band.

Note the correspondence with the item’s fracture zone.

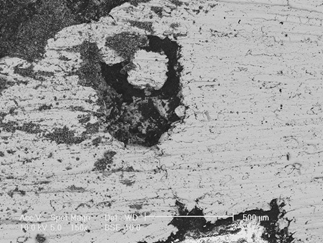
Figure 55 . Extension of the cavity in the other half of the sectioned wedding band

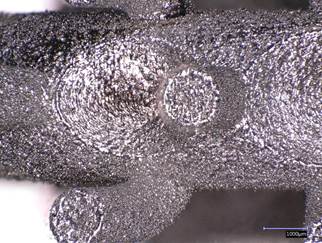
Figure 56 . Surface swelling in a model 2 trilogy produced by SLM™


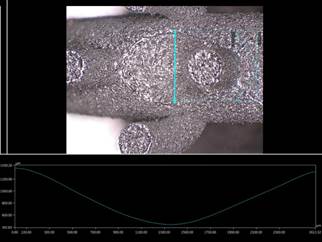
Figure 57 . Surface swelling in the model 2 trilogy in Figure 56 compared with the standard profile

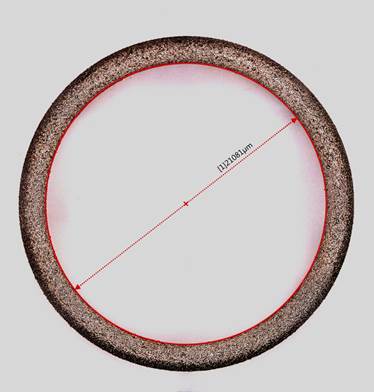
Figure 58 . Example of digital measurement


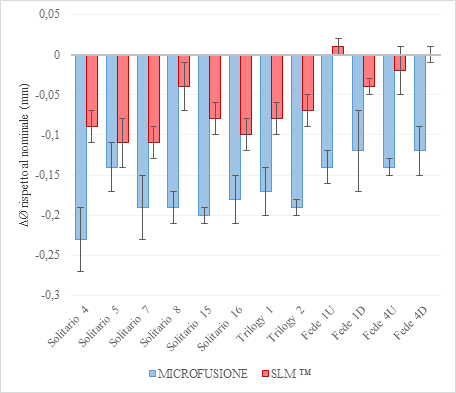
Figure 59 . Offset compared to the nominal internal diameter measurement with standard deviation

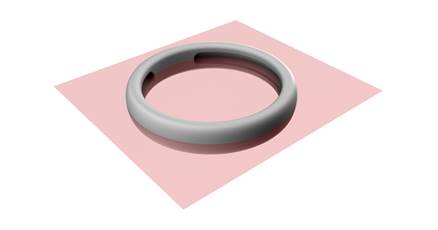
Figure 60 . Section A plane

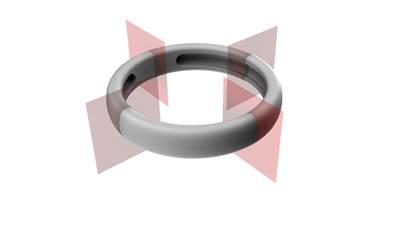
Figure 61 . Section B planes

Figur e 62. Micro-cast wedding band 1

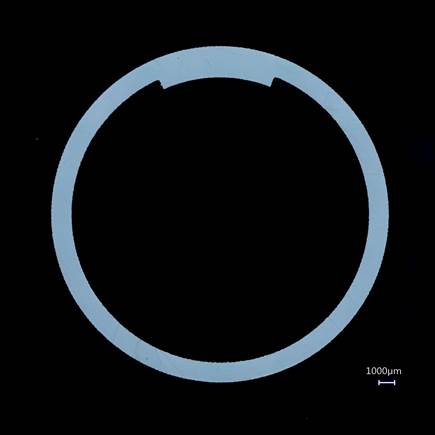
Figure 62 . SLM™ wedding band 1

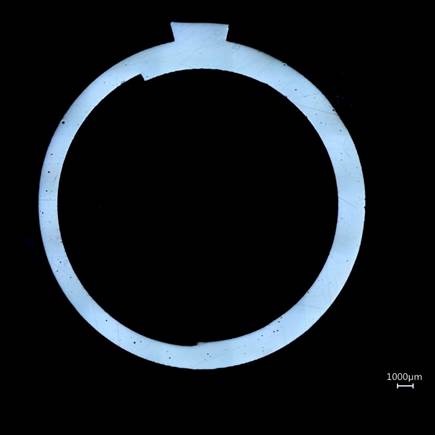
Figure 63 . Micro-cast wedding band 4

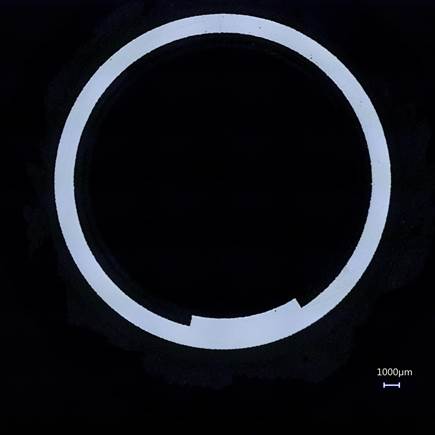
Figure 64 . SLM™ wedding band 4

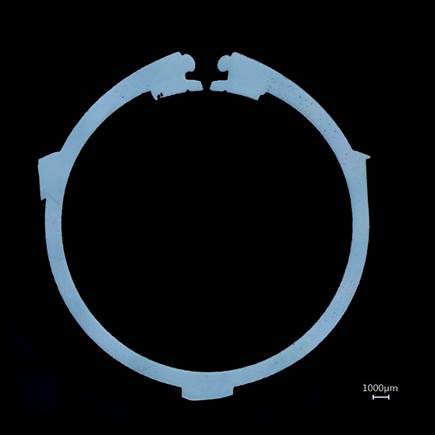
Figure 65 . Micro-cast solitaire 4

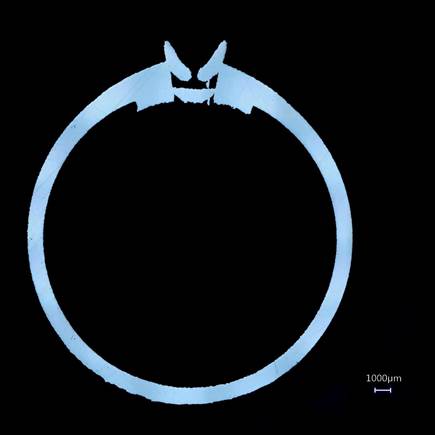
Figure 66 .  SLM™ solitaire 4

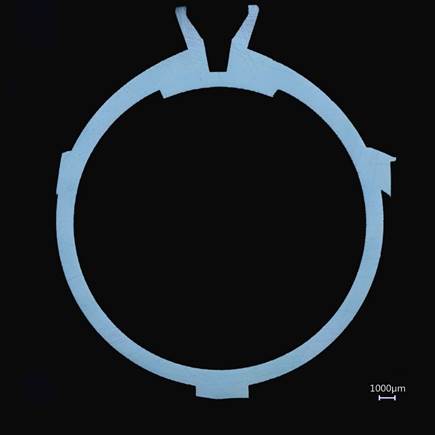
Figure 67 . Micro-cast solitaire 5

Figure 68 . SLM™ solitaire 5

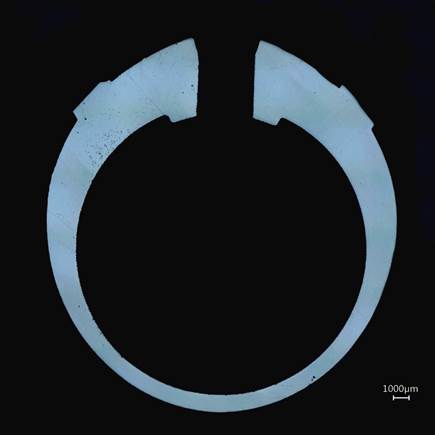
Figure 69 . Micro-cast solitaire 7

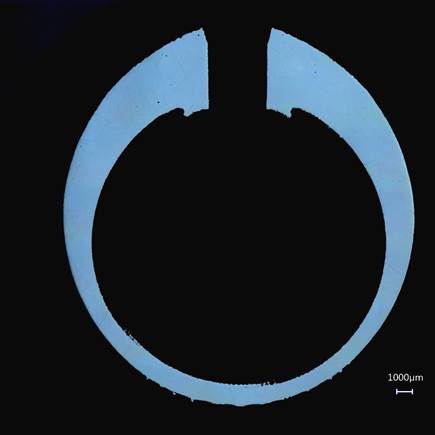
Figure 70 . SLM™ solitaire 7

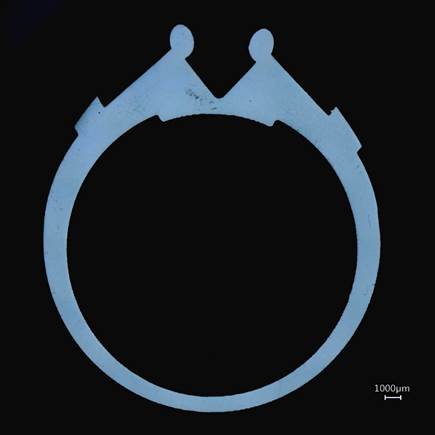
Figure 71 . Micro-cast solitaire 8

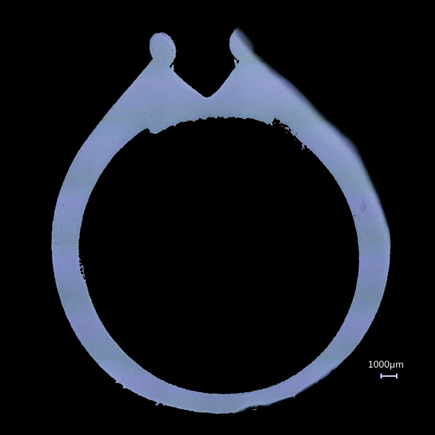
Figure 72 . SLM™ solitaire 8

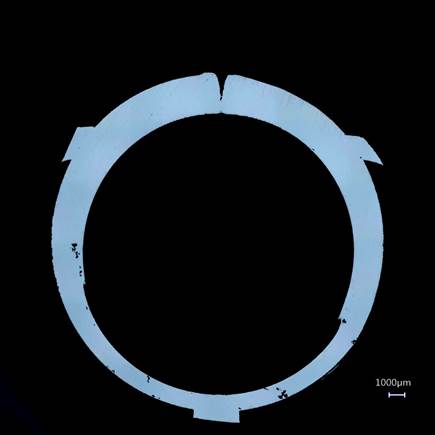
Figure 73 . Micro-cast solitaire 15

Figure 74 . SLM™ solitaire 15

Figure 75 . Micro-cast solitaire 16

Figure 76 . SLM™ solitaire 16

Figure 77 . Micro-cast trilogy 1

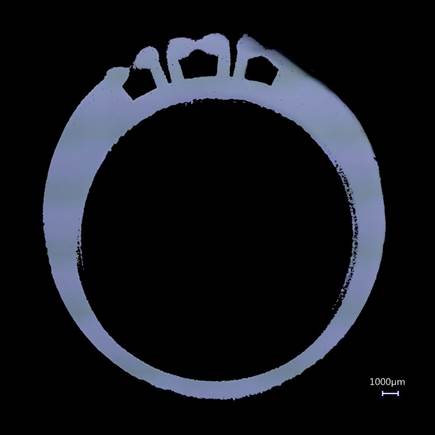
Figure 78 . SLM™ trilogy 1

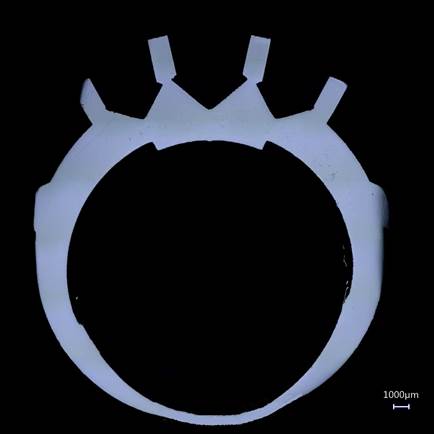
Figure 80. Micro-cast trilogy 2

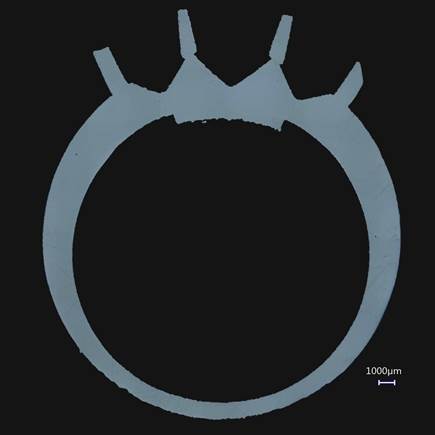
Figure 81. SLM™ trilogy 2

solitario15_1_micro_01_50x_5

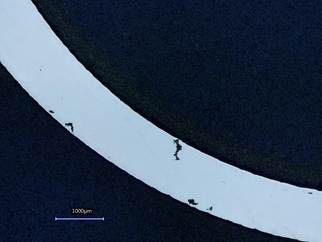
Figure 82. cavity in micro-cast ring section

solitario_4_micro_50x_10

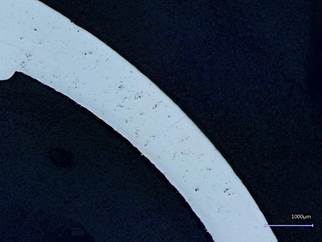
Figure 83. porosity from shrinkage in micro-cast ring section

sol_7_SLM_2_01_50x

Figur e 84. Porosity from gas in SLM™ ring section

solitario16_1_SLM_01_50x_2

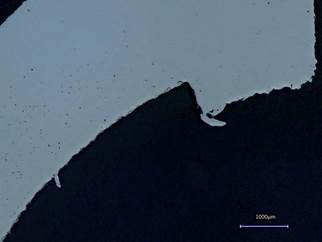
Figure 85. Porosity inter-hatches in SLM™ ring section

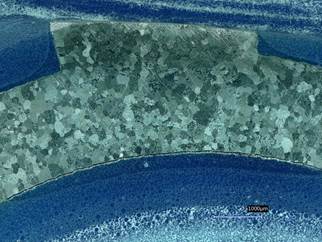
Figure 86. "as cast" micro-cast wedding band after metallographic attack, 50x

Figur e 87. “as cast” micro-cast wedding band after attack, 200x

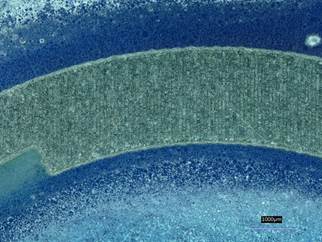
Figure 88. "as print" SLM™ wedding band after metallographic attack, 50x

Figure 89.  "as print" SLM™ wedding band after attack, 200x

Figure e 90. Micro-cracks visible in the SLM wedding band after metallographic attack

Figure 91. Traction tester

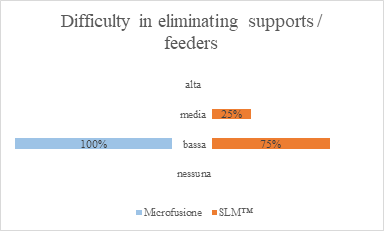
Figure 92. Evaluation of the difficulty in removing supports/feeders

Figur e 93. Evaluation of roughing difficulties

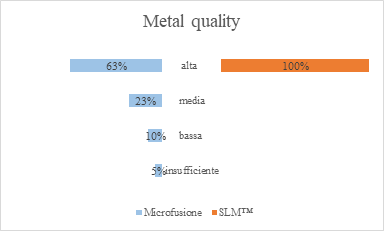
Figure 94. Evaluation of the surface quality after roughing

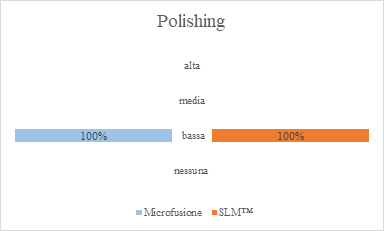
Figure 95. Evaluation of polishing difficulties

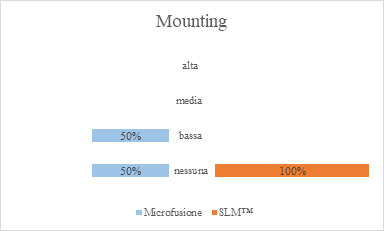
Figure 96. Evaluation of mounting difficulties

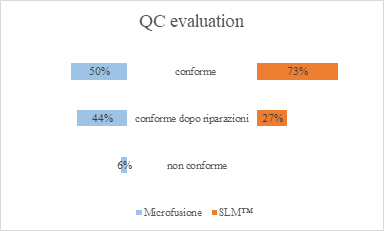
Figure 97. Stilnovo s.r.l.’s internal Quality Control evaluation of the jewellery produced by SLM™ and by micro-casting

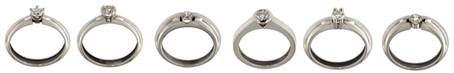
Figure 98. Micro-cast solitaires

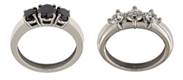
Figure 99. Micro-cast trilogies

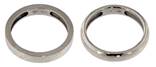
Figure 100. Micro-cast wedding bands

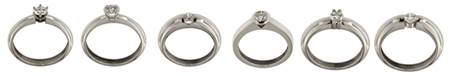
Figure 101. SLM™ solitaires

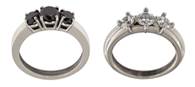
Figure 102. SLM™ trilogies

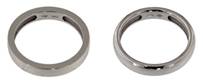
Figure 103. SLM™ wedding bands

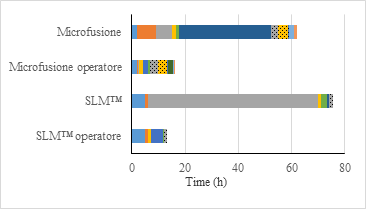
Figure 104. Overall machine times for technique used and total man hours

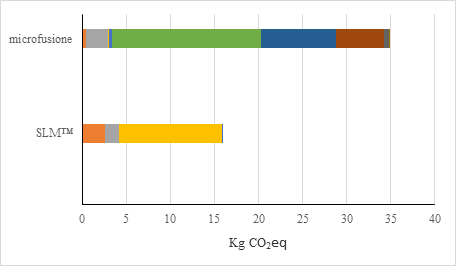
Figure 105. Kg of CO2 equivalent produced by each of the two techniques


Table


1


. List of items produced for each model and production technique

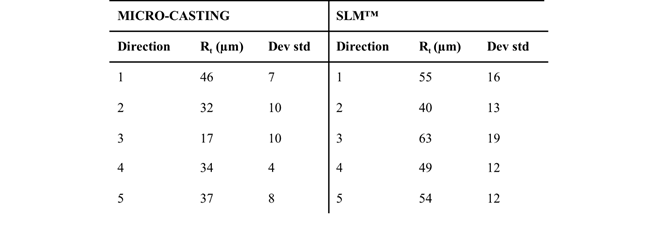
Table 2 . as cast / as print roughness

Table 3 .Roughness after sanding or shot peening

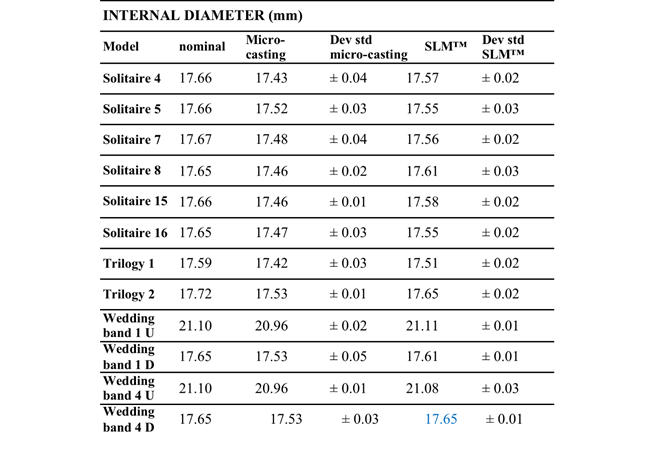
Table 4 . Internal diameters measured for each model compared to nominal diameters

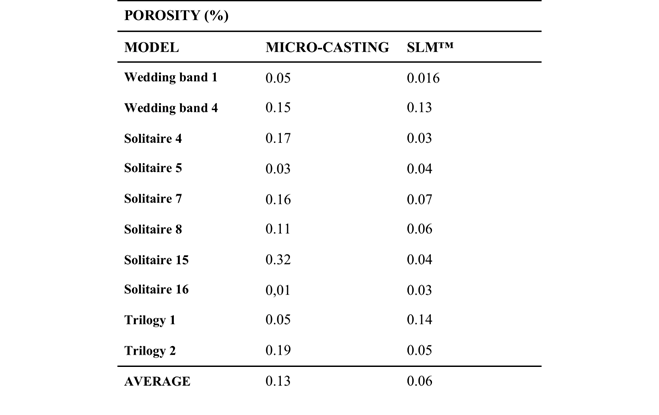
Table 5 . Average percentage porosity found for the two production techniques in question

Table 6. Vickers micro-hardnesses on micro-cast and printed model 1 wedding bands

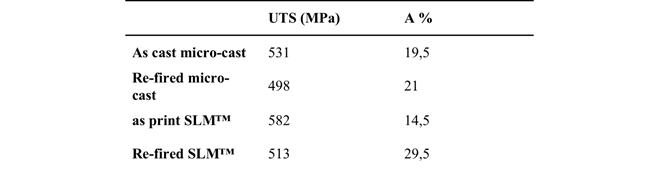
Table 7. Mechanical characteristics

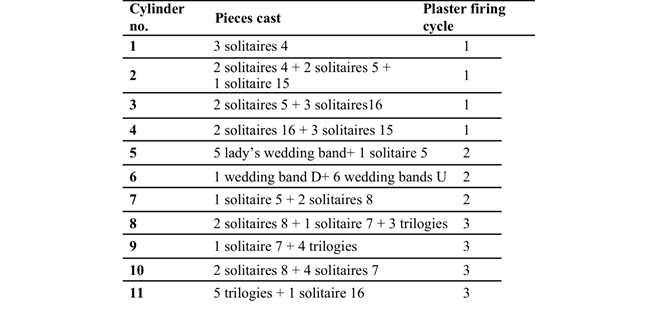
Table 8. Casting subdivision

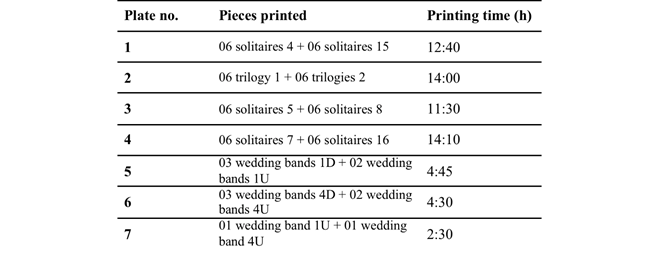
Table 9. Print subdivision and relative production time

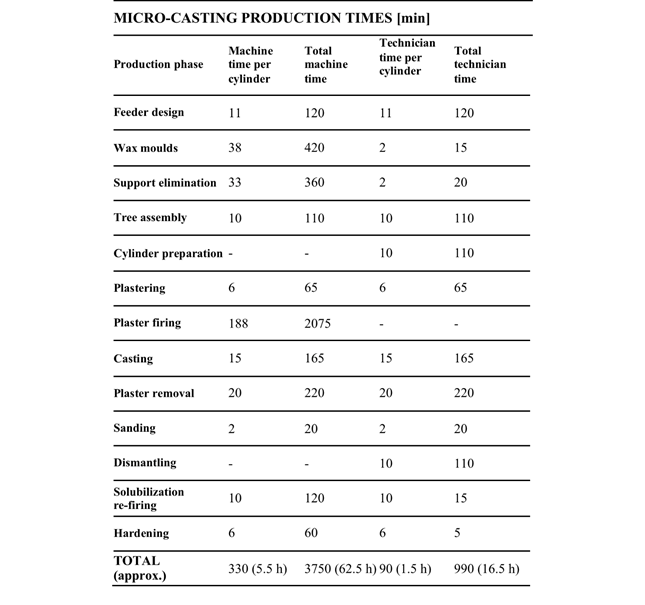
Table 10. Average and total machine and technician times for producing the rings with micro-casting

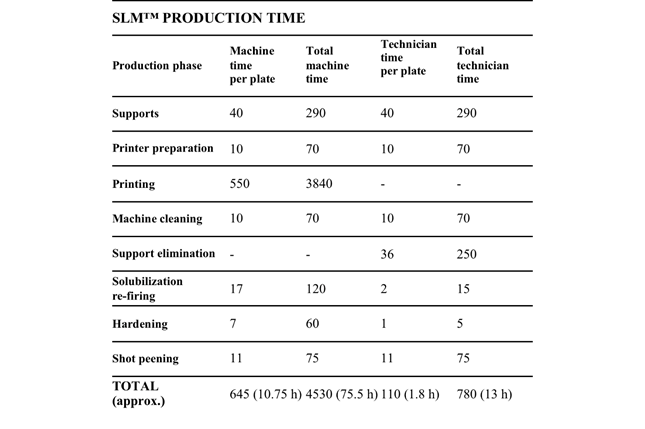
Table 11. Average and total machine and technician times for producing the rings with SLM™

Table 12. Subdivision of micro-casting production phase times

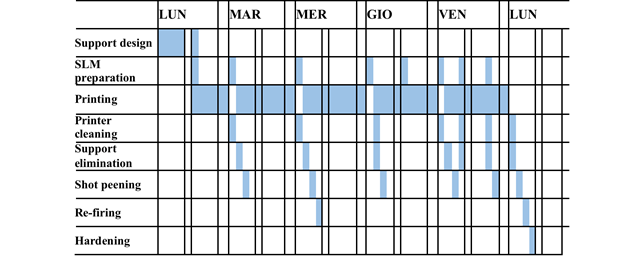
Table 13 . Subdivision of SLM production phase times

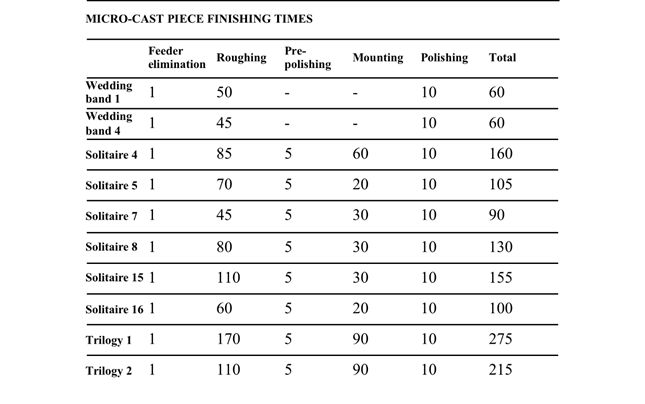
Table 14. Finishing operation times (in minutes) for rings produced by micro-casting

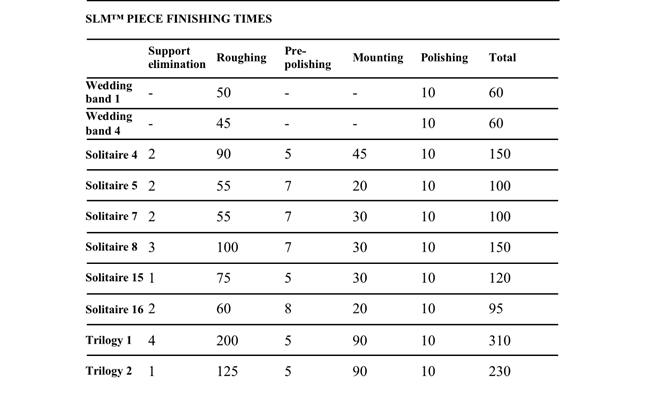
Table 15. Finishing operation times (in minutes) for rings produced by SLM™

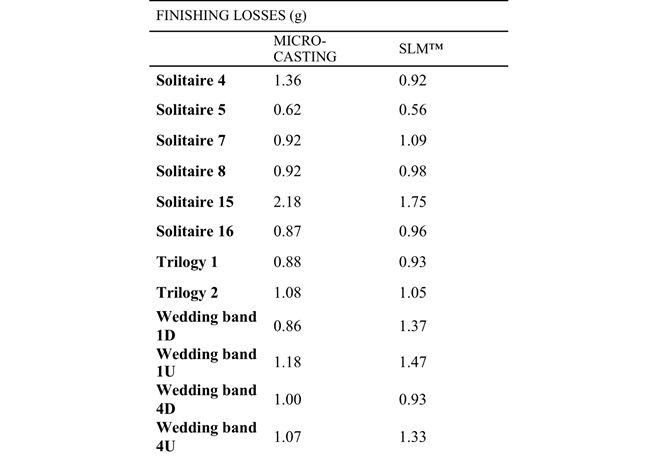
Table 16. Overall finishing losses

Table 17. Costs relating to losses registered in the finishing phase,

assuming a 5% loss in the recovering phases

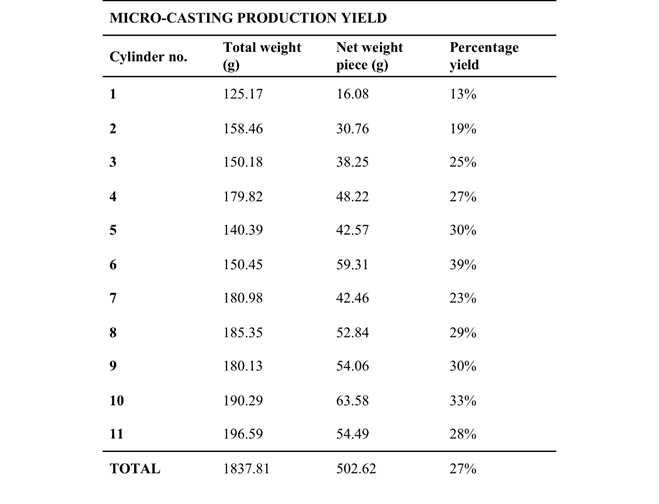
Table 18. Percentage production yield with micro-casting

Tab le19. Percentage production yield with SLM™

Tab le 20. Average refining costs on the Italian market

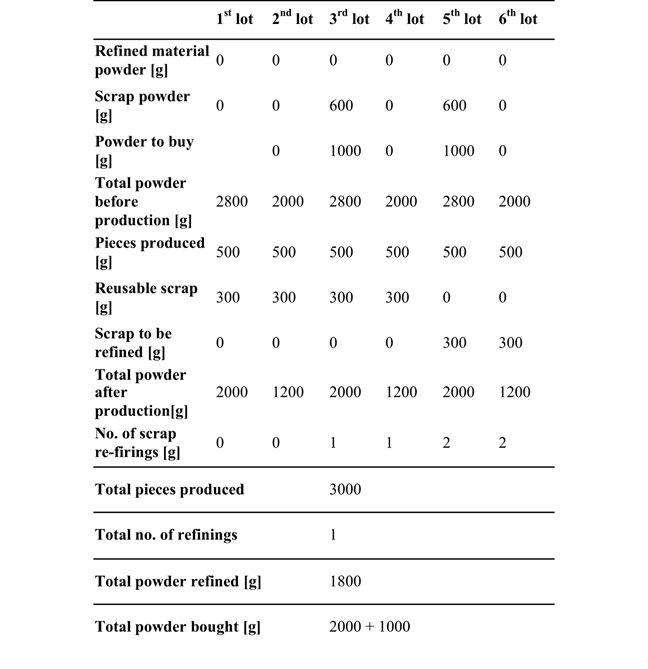
Table 21. Material to be refined for producing with SLM™

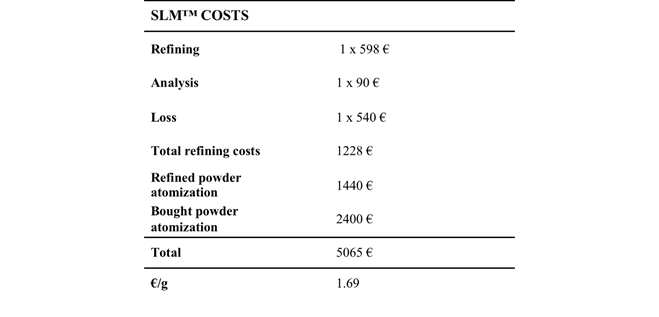
Table 22. Refining costs for producing with SLM™

Table 23. Material to be refined for producing with micro-casting

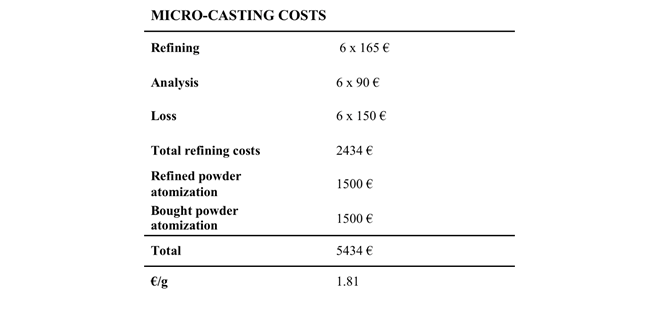
Table 24. Costs of refining for producing with micro-casting

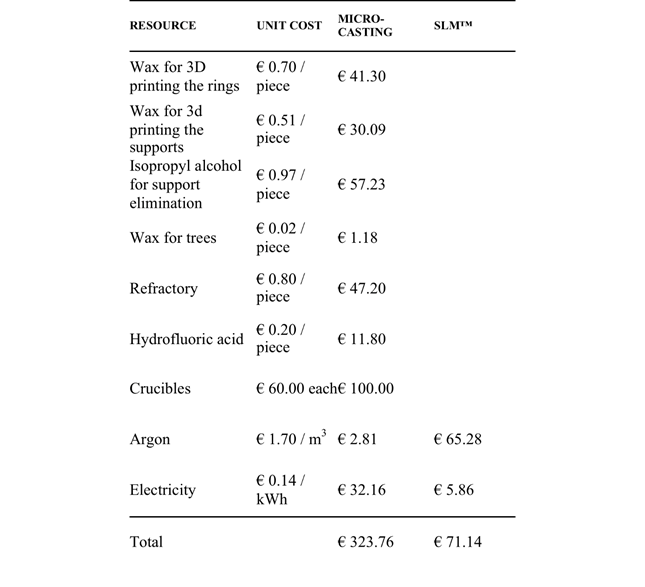
Table 25 . Consumer materials needed for production

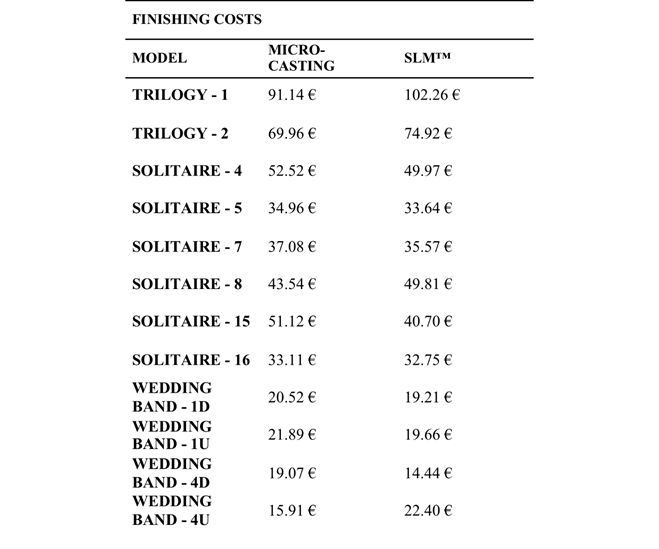
Table 27. Finishing costs, including losses, for each ring subdivided by model

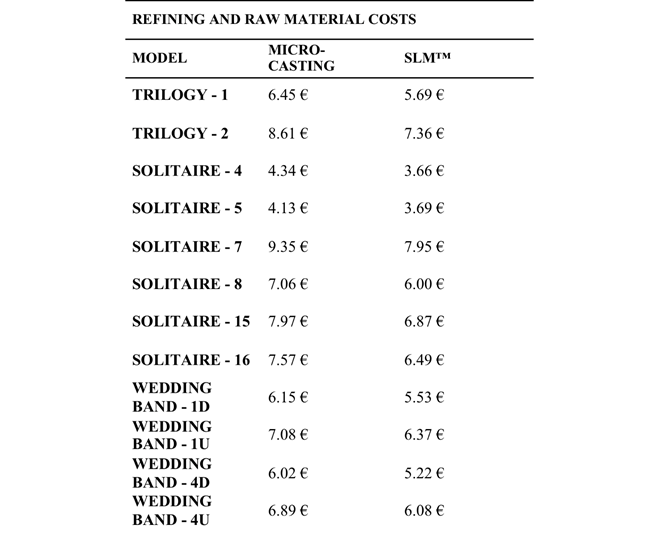
Table 28. Refining costs for each ring subdivided by model

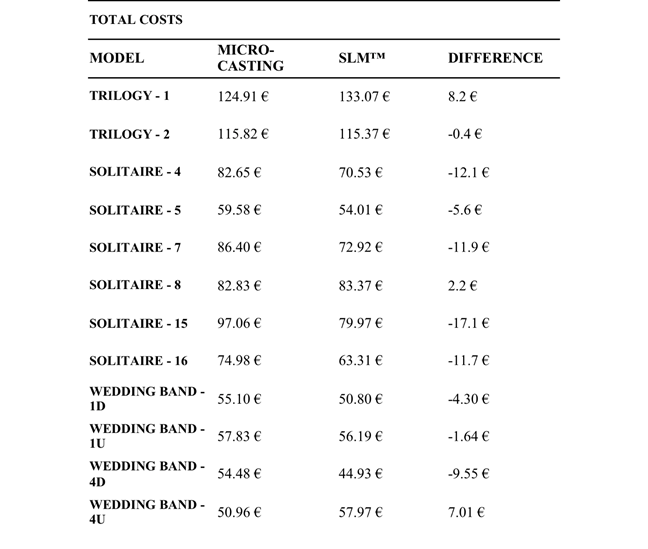
Table 29. Total production costs, including costs for producing semi-processed items,

finishing and refining

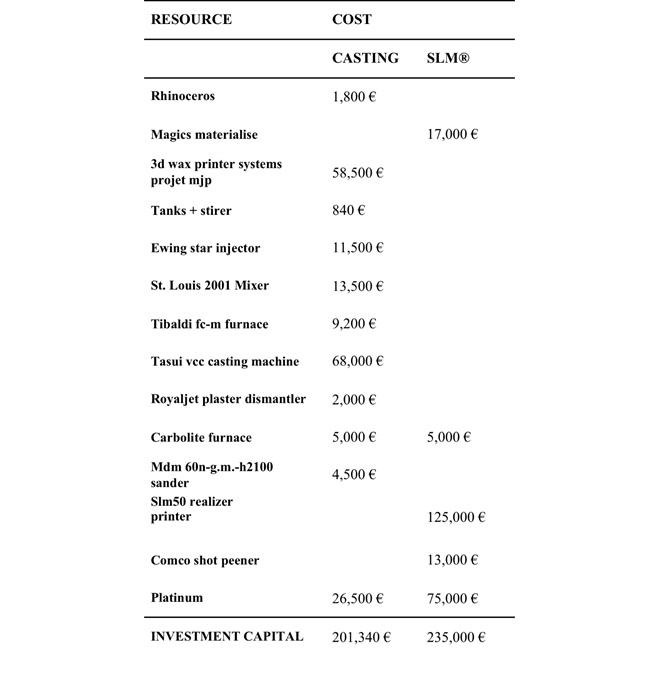
Table 30. Investment capital needed to start production with micro-casting and SLM™
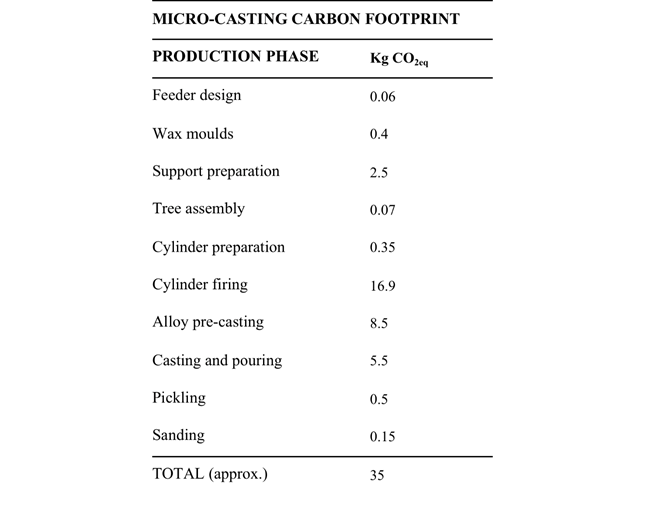
Table 31. Kg of CO
2 equivalent produced in micro-casting
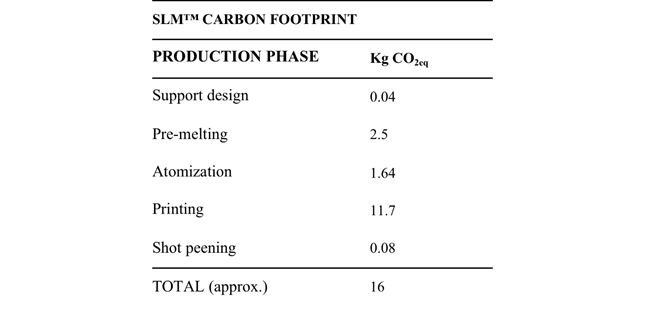
Table 32. Kg of CO
2 equivalent produced in SLM™

Continue reading

Lavorazione meccanica: focalizzare i punti critici

Andrea Friso

Product Division Manager – Legor Group S.p.A. – Bressanvido VI – IT

Andrea Friso attualmente ricopre in Legor Group S.p.A. il ruolo di Division Sales Manager per la divisione Master Alloy. Laureato nel 2003 in ingegneria dei materiali presso l’Università di Padova con una tesi su leghe d’oro di colori innovativi in collaborazione, collabora con Legor Group sin
dal 2004. È in azienda la figura professionale che opera da tramite fra forza vendite, area produttiva e area R&D, grazie all’esperienza maturata sulle diverse tipologie di prodotto e sul loro posizionamento sui diversi Mercati. Supporta la forza vendite nella pianificazione commerciale,
nel raggiungimento degli obiettivi e nel loro controllo periodico. Collabora con l’area tecnica e con l’area R&D relativamente allo sviluppo, l’avanzamento, la promozione dei prodotti.

La memoria intende concentrarsi su alcuni aspetti fondamentali del perché la deformazione plastica di una lega è così importante nel mondo produttivo orafo, e in seguito esemplificare tipici errori che si compiono in produzione, che portano a catena a dei problemi difficili da correggere a fine
processo. Obiettivo della memoria è quello di accompagnare i partecipanti in alcuni percorsi logici utili a ragionare su certi aspetti causa/effetto relativi al processo produttivo di deformazione plastica. Uno dei casi più comuni di difettosità in lavorazione meccanica è ad esempio l’ottenimento
di semilavorati che hanno problemi di fragilità o di tensioni residue, le quali possono avere cause diverse, singole o combinate, e che sono talora difficili da individuare. Inoltre, i processi attuali sono mediamente più complessi rispetto a quelli di anche solo una decina d’anni fa, a causa
di lavorazioni più spinte, o di controlli qualità più stringenti.

Scarica la presentazione


Continue reading

Improving abrasion and corrosion resistance of black finishes in the decorative sector

Improving abrasion and corrosion resistance of black finishes in the decorative sector

Introduction

Black decorative surface finishes are existing in several variations of accessible technologies and used every day covering a wide range of application methods. Though these methods have been used on an industrial scale for years, each method carries its own limitation. As the base substrates treated
have a high probability to be white in color in the case of aluminum, steel, and silver, or in other cases pre-plated with a white layer used to protect the base substrate as in the case of brass and zinc alloy, abrasion resistance is a key qualitative factor used to benchmark all categories
of black decorative surface treatments. As the black layer wears, the white layer is exposed, leaving a color contrast that is well defined by the human eye making it a rather simple task for the final buyer to evaluate the quality of the product as it ages. 

Specific to electroplating, black plating process have seen several modifications in recent years. With the European REACH compliance in full effect, some chemicals previously used as blackening additives or oxidizing agents can no longer be used. Metals historically used for black electroplating
such as nickel, cobalt, and chromium remain under constant scrutiny, increasing awareness of brands, buyers, and government agencies resulting in requests for limited use or no use of these metals increasing year by year fundamentally in the cases where the final object is to be worn or in contact
with human skin.

Some commonly used REACH compliant black processes in the decorative electroplating sector are black ruthenium and black rhodium. These treatments are generally considered flash with a maximum obtainable thickness of 0.2 micron and rather easy to be worn in time even with the elevated hardness of
both metals.

This paper will follow the development of a black gold electroplating process, run comparative trials against commonly used black decorative applications in our industries today, and explore its possible advantages both as a final and technical layer,    

Black decorative finishing technologies

Numerous types of black finishing methods are available and vary depending on the original substrate to be treated and the industry where applied. Though these processes are quite abundant in number, application, design, and cost limitations come to fruition when examined.

 Anodizing is a process for finishing aluminum alloys that employs electrolytic oxidation of the aluminum surface to produce a protective oxide coating. These coatings can be colored to a limited range including black. Though anodizing has a vast functional usage industrially, the process is used
heavily as a decorative method in many sectors to include home appliance, electronics, and most notably the mobile phone sector due to its cost/quality ratio. As the process is essentially a coloration of the metals natural oxide layer, anodizing is part of the aluminum itself providing total
bonding and excellent adhesion properties. The principal drawbacks to the process in general is that it tends to disrupt detail therefore it use is partial to simple shapes and the application itself is limited to aluminum and very few other non-ferrous metals restraining the processes overall
usage decoratively speaking.  

Paint and coatings are solvent or water diluted resin processes that provide the widest range of colors and effects of all the methods discussed. Though processing sequences may differ, paint and coating can be applied to any metallic or even plastic substrate. Due to this fact its usage can be found
in just about every sector examined however the spectacle frame market can be identified as having the most mature use of paint in the higher quality decorative ornament market. Many variations of black are obtainable with this type of application.  Single layer cataphoretic coatings (e-coatings)
are quite cost effective however suffer in either durability or oxidation resistance depending on the type of resin used. This set back can be circumvented with the use of 2 and 3 paint layer systems applied by spray using multiple resins, however in the end produces a higher cost due application
time and a raw material loss of up to 70%. The downside to the use of paint would be the fact that it disrupts the mechanical movement of functional parts such as claps, chains, and snap hooks. In the specific case of the spray application, it bonds to any substrate it contacts therefore jewelry
use is limited due to the constant presence of gemstones. Paint has also been stigmatized as “cheap” due to the plastic feel it tends to give to metal therefore many luxury goods sectors, depending on brand position, will not consider its use.

Physical vapor deposition (PVD) is a process that uses a vacuum chamber to pressurize a target into vapor which is then altered into a condensed film on the objects surface. Applicable substrates are limited to the temperature required to make the particular deposition which can be quite high limiting
use. This process is able to yield several colors to include black. One of the more recent process used is diamond like carbon (DLC) which produces a jet-black layer that is extremely hard and resistant to abrasion. Initial equipment investment is rather high making PVD by far the most expensive
technology discussed being difficult to find economically outside of China. Though very resistant to abrasion and wear, the chemical resistance of PVD tends to be rather weak due to the formation of microscopic pin holes formed in processing. This is eventually overcome with multiple treatments,
however the cost of the treatment is also dramatically affected. Given the watch sector uses stainless steel as a base material, maintains an elevated abrasion resistance requirement, and the geometries treated are standardized, makes it the perfect candidate for PVD and it use is widespread
throughout the sector.

Black electroplating treatments are vast using a large variety of metals to obtain the targeted result. Two of the most demanding decorative markets for this type of plating are the jewelry industry and the fashion accessories sector. Both sectors can be divided into high and low end segments. The
low end segments utilize metals such as chrome, nickel, tin, cobalt, or an alloy thereof principally due to cost. Though these metals are cost effective, the finishing obtained is not enough to pass normative climatic testing required by some brands. This fact paired with the increasing request
for nickel free finishes and stricter regulation as in the case of the European Unions REACH legislation, the higher end segments lean on metals such as palladium, rhodium, and ruthenium to obtain a black color. High end jewelry tends to use black rhodium where as high end fashion accessories
utilize black ruthenium. Where black ruthenium and black rhodium are able to pass most climatic testing if used with the proper pre-plating sequences, both have a maximum obtainable thickness of 0.2-0.3 micron so tend to present abrasion resistance issues. This is circumvented at the moment in
both high end sectors buy covering the metal with a paint to improve on abrasion or just by accepting the fact that the color will wear in time.

Which leads one to ask, is an abrasion resistant black layer obtainable without the use of paint, while maintaining both nickel free processing and REACH compliance? If so, can the market cost be bared?          

Nickel free black gold

Both rhodium and ruthenium have a maximum obtainable thickness of 0.2-0.3 micron mainly due to the fact that they are mono-metal systems that become brittle with thickness. With a target to improve abrasion resistance, the first objectives would be to maintain a good hardness while making the layer
more malleable and opening the range of reachable thickness. Omitting the use of nickel and cobalt to remain hypoallergenic as well as the use of copper which remains a principal source of oxidation, a bi-metal electrolyte was studied that included gold, palladium, and iron. The system was studied
at an alkaline pH to well receive the selected metals with gold in the highest concentration and iron with the lowest concentration of the metals used to develop the chemical.

Table 1 – Black gold electrolytic characteristics

Surface evaluation of the black gold alloy

When processed, the electrolyte produces an  alloy that is black in color and consists of 49% palladium, 39% gold, and 12% iron by weight making the deposit roughly 12.5 KT gold by title. To evaluate the alloy color,
the CIELab color coordinate system is used with principal focus on the L coordinate when evaluating black finishes.

Table 2 – Color coordinate comparison of black gold, black ruthenium, and black rhodium

The L coordinate is the luminosity value which in this case determines the overall darkness of the black deposit with the lower L value equating to a darker shade of black. The L value of 58 was measured with the black gold alloy.

This fits into the higher range of the industries standard black colors with L coordinates ranging from 50-60 in the case of black rhodium and a much wider availability of black shades with ruthenium having L coordinates ranging from 32-60. The most commonly used formulas of both rhodium and
ruthenium have L coordinates of 58 or 59.

Hull cell testing was conducted to identify the current density range, resulting in a mirror finished black panel produced at
1.0 A/dm
2 after 10 minutes of deposition time. This paired with the fact the electrolyte demonstrated good reach and throwing power, 1.0 A/dm
2 optimum current density value.

Thickness tests were done with the use of SEM/EDX microscope. Lab trials concluded that a level deposit of up to 2 micron was obtainable while maintaining a mirror like finish expected in the high end decorative plating sector.  With accurate thickness measurements, plating speeds were calculated
obtaining 1 micron in 12-15 minutes at 1.0 A/dm².

Chemical observations

The chemical has proven stable over a 12 month duration of time exhibiting no participation chemical elements if the proper pH is maintained. A fluctuating pH was detected in the electrolyte observing the pH dropping by roughly 0.2 each day.

The lowering pH can be corrected with the addition of pH adjustment salts, however would entail that operators of the black gold solution would have to monitor the pH solution of the daily, giving the electrolyte similar maintenance characteristics to a gold sulfite bath.

Figure 1 – pH variance in an 18-day period

Market segment plating sequences

Two of the more mature and standard black plating sequences were evaluated in each high-end market segment. In the case of jewelry, black finishing over silver was assessed as one of the more standardized cases. Starting from a base material of .925 silver, palladium is applied as the initial plating
layer followed by black rhodium in the most common finishing cycles. In this example, palladium is applied as a technical layer serving a dual use. The first improving the overall resistance to oxidation acting as a barrier to copper migration as well as preventing corrosion from environmental
factors. The thicker the palladium layer, the stronger is the resistance to climatic testing. The second reason for palladiums use is electrolyte protection. Palladium as a metal does not corrode in an acidic environment, whereas silver and the copper that it is alloyed with does. If the palladium
step is skipped, silver and copper will eventually disrupt the final quality deposited as their presence increase with time in the rhodium bath in the form of metallic contamination.

The high-end fashion accessories sector uses a completely different finishing cycle to obtain a similar color. The principal reason being that the initial base materials are typically either brass or zinc alloy and require a different plating sequence to finish to a high-quality result.  The most
commonly used cycles consist of 5-7 plating processes involving many layers for technical benefits. The selected sequence starts with alkaline copper for adhesion, followed by acid copper for surface brightness, moving to white bronze for improved hardness, then to palladium for oxidation resistance,
and finally 1-2 layers of ruthenium. In the case 2 ruthenium layers are used, the first layer is light grey ruthenium which is then followed by black ruthenium, improving the overall products wear ability in the end.   

To incorporate the black gold alloy into the selected plating cycles would allow for the addition of the new layer to be measured using the two industries most standard processes as the qualitative benchmark. 

Black Gold jewelry plating sequence

In the case of the proposed changes to the jewelry process cycle, the black gold was selected to replace palladium as the technical layer given the black gold alloy itself contains a high percentage of palladium along with the additional fact that both electrolytes have a similar alkaline pH would
mean minor processing deviations.

Sterling silver .925 parts were processed directly with 0.3 micron of the black gold alloy followed by 0.2 micron of black rhodium. Additional parts were processed with 0.3 micron of palladium and 0.2 micron of black rhodium to be used as benchmark in abrasion and corrosion testing. Following the
treatments, the samples processed using the black gold as an under layer had a visibly darker color that those processed with palladium, even though the final finish was the same black rhodium processed using the same parameters. This process defined in this paper as process sequence 1.

Figure 2 – Top row: Plating sequence chosen as reference cycle; bottom row: Test cycle with the implementation of black gold.

Black Gold fashion accessory plating sequence

The selected changes to the fashion accessory process cycle were different given the complexities of the plating process itself. In this case, we focused on the finishing cycle which incorporates 1 layer of ruthenium in the sequence. The black gold deposit was tested as a technical layer by using
it to replace the palladium layer in order to keep a similar cost, making quantitative room for the black gold. This process defined in this paper as process sequence 2.

Figure 3 –
Top row: Plating sequence chosen as reference cycle; bottom row: Test cycle with the implementation of black gold.

In addition, the black gold was implemented into the process as a final finish given that it shares a similar color to gunmetal grey ruthenium. As both deposits have an L coordinate of 58, this would be used to benchmark the black golds resistance to oxidation with a market segment standard.

Figure 4 –
Test cycle with the implementation of black gold as a final layer to test in contrast to ruthenium.

Brass parts were processed both with standard market segment plating sequences, and the relative black gold process deviations for qualitative testing.  This process defined in this paper as process sequence 3. 

Comparative testing

On the basis of the above information, the parts processed with more common plating cycles from the two selected market segments were comparatively tested against those processed with the black gold layer positioned in the sequence. Standardized normative testing methods were used to simulate oxidation
and abrasion.

Abrasion resistance

The test method used to gauge abrasion resistance in the high fashion accessory market is the Turbula test, designed to simulate wear or abrasion. A specific machine is used in which the rotation is mounted on a pivot creating a more aggressive environment compared to a standard tumbler.

The media used is elongated pyramid shaped ceramic, with a distinct form granting both sharp and flat contact points simulating two aggressive forms of abrasion. Testing is preformed with the media weighing roughly 41 grams per 100 pieces. Five parts are treated each test, with a fixed evaluation
phase following a turbula cycle at a fixed time and speed of 72 RPM.

Jewelry sequence results

Following one 3-minute abrasion cycle, the .925 silver specimens which utilized the black gold deposit as an intermediate layer proved to be more resistant to abrasion than the parts treated with the traditional palladium process. Further evaluation determined a better bonding between the black gold
and black rhodium layer when compared to traditional plating methods.

Figure 8 – Top row: palladium as an intermediate layer; bottom row: black gold as an intermediate layer both after abrasion cycle


Fashion sequence results

Following one 30-minute abrasion cycle, the brass samples which utilized the black gold deposit as an intermediate layer proved to be more resistant to abrasion than the parts treated with the traditional palladium process which demonstrated complete loss of the ruthenium layer and a failed result.

Figure 9 – Left: black gold as an intermediate layer; right –  palladium as an intermediate layer both after 30 minute abrasion cycle 

Synthetic sweat resistance

The synthetic sweat normative the high-end accessories perform is NFS 80-772:2010-10 which is a direct contact test and more aggressive than atmospheric versions of the test. Following this normative, samples are put into direct contact with an absorbent felt which has been doused with an artificial
sweat solution. The sample is sealed air tight and held at a consistent temperature of 55⁰C. The samples are then held for a predetermined duration of time in increments of 24 hours.

Following one 24-hour synthetic sweat cycle, the .925 silver samples which employed the black gold deposit as the middle layer demonstrated superior resistance compared to the parts treated with the customary palladium procedure. The surface of the pieces using the palladium process revealed elaborate
signs of chemical aggression.

Figure 9 – Top row: palladium as an intermediate layer; bottom row: black gold as an intermediate layer both following 24-hour synthetic sweat cycle.

Salt spray

Following the ISO normative 9227, objects to be tested are suspended in a sealed chamber and submitted to a constant salt spray for a predetermined duration of time. The test is designed to simulate a corrosive environment and test the substrates resistance in a cycle time 96 hour.

To test the salt spray resistance of the black gold alloy, process sequence 3 was used because in this case the black gold alloy is exposed as the final layer.

Following one 96 hour salt spray cycle, the brass  samples finished with both ruthenium and the black gold alloy showed no signs of corrosion.

Figure 9 – Left: Black Gold as top layer; Right:: Ruthenium as top layer both following 96 hour salt spray cycle

Conclusions

Initial laboratory testing has shown that the black gold alloy improved qualitative results when used as a technical/intermediate layer most notably, synthetic sweat resistance when applied over silver as a substitute for palladium and finished with black rhodium. When tested as a final layer, the
corrosion resistance was similar to that of ruthenium, but given the large cost differences when comparing palladium and gold with that of ruthenium and paired with the fact that the two electrolytes yield the same color, the use in this sense is unlikely.

The fluctuating pH of the black gold electrolyte can be seen as a limitation as it restricts the products use to qualified plating factories as it cannot be used in beaker plating which is quite common in the jewelry sector.

 Testing will continue into the future as the black gold electrolyte offers a wide range of obtainable thicknesses and considering the many different process sequences used throughout the decorative finishing industry, open up many doors of opportunity for this process, if combining electroplating
with other technologies such as PVD continues to gain popularity.

In the end, enhanced abrasion and corrosion resistance will remain a central target for many companies in the surface finishing sector. Qualitative improvements to commercialized goods improve customer satisfaction, increase brand reputation, and most importantly decrease our overall footprint to
the ecosystem with longer lasting products.

Continue reading

Improving your investment casting process

JÖRG FISCHER-BÜHNER

Consulente in Ricerca & Sviluppo

Il Dr. Jörg Fischer-Bühner ha conseguito un dottorato di ricerca. in metallurgia e tecnologia dei materiali presso il Politecnico RWTH Aachen. Da ottobre 2007 è attivo nella ricerca e sviluppo e collabora come consulente in Legor Group S.p.A., Italia, e in Indutherm GmbH, Germania. Prima è stato Responsabile della divisione di fisica metallurgica e ricerca sui materiali preziosi presso il FEM, l’Istituto di ricerca tedesco sui metalli preziosi e chimica dei metalli.

Scarica la presentazione


Continue reading

Development of New 950Pd Investment Casting Alloys with Superior Properties

Development of New 950Pd Investment Casting Alloys with Superior Properties

State of the Art

Palladium alloys were a topic at the Santa Fe Symposium mainly during 2006 and 2009 when the Pd demand in the jewelry section increased rapidly. Several papers on the palladium market [1], the investment casting process [2-4] and on the fabrication and manufacturing [5, 6] were published. The first investment
casting study on 950Pd alloys was presented by Fryé [4]. Due to the fact that limited information was available, the core purpose of this paper was to gain a better understanding of the casting characteristics of 950Pd alloys used in the jewelry industry. The work of Battaini [2] aimed at presenting
the main physical and chemical properties of palladium-based dental alloys and transferring the experience acquired in the dental field to the goldsmith’s.

In 2007 a study of the investment casting of 950Pd alloys was conducted by fem on behalf of Palladium Alliance International (PAI). The results were presented at the Santa Fe Symposium in 2008 and published in 2009 [3]. In the following section the main findings of these studies will be summarized.

2.1 Typical casting challenges with 950 Palladium alloys

Commercial 950 palladium alloys contain Ru, Ga or Co as main alloying elements. Table 1 provides a list of alloys with their most important properties and characteristics.

Table 1:                Overview on commercial palladium alloys taken from manufacturer’s alloy datasheets. AC = as cast, CW = cold worked, AN = annealed.

Ruthenium (Ru) is a platinum group metal with a white color that alloys well to palladium. Ru containing alloys show a higher melting temperature, because Ru increases the solidus and liquidus temperature according to the binary phase diagram. Ru has a limited solubility in palladium and therefore only
950Pd-Ru alloys are manufactured. The increase of the melting range by the addition of Ru requires higher casting temperatures compared to pure palladium. This results in higher thermal stress to the crucibles and investment materials during casting. The melting range of 950PdRu is very small, only
a few degrees Celsius. Some values given in manufacturer’s data sheets for 950PdRu are contradictory to phase diagram information. This is attributed to further alloying additions that are not specified or to the difficulty in the determination of the real melting range.

During solidification dendrites are formed and Ru segregates to the dendrite core and the remaining melt enriches in Pd. Usually the melting range increases due to segregation, but this is very limited for 950PdRu. As a consequence the alloy shows a nearly isothermal freezing and therefore a very limited
form filling during casting. This process was investigated in detail for 950PtRu [15].

Ru dissolves in palladium to form a solid solution. Pd-Ru alloys are relatively soft, because of the small difference in the atomic size of Pd and Ru. The typical hardness is about 100-120 HV1 in the annealed or as-cast condition. In order to improve the mechanical properties additions of Gallium
(Ga) are frequently used.

The binary phase diagram of Pd with Ga is shown in Figure 1. Ga has a very low melting point (29°C) and its addition significantly lowers the solidus and liquidus temperature of Pd. The maximum solubility in Pd is ca. 8 mass% Ga. At higher Ga concentration many intermetallic compounds form in complex
phase reactions. No systematic studies are reported on the precipitation hardening of Pd-rich alloys in the open literature. However, such studies are available for Pt alloys [16] and the results can be transferred to Pd.

Precipitation hardening is well-known and applied for 950Pt alloys [16, 17]. However, the solubility of Ga in Pd is higher than in Pt. Therefore, higher amounts of Ga are required in order to achieve the same hardness level – or for a given Pd content, e.g. 950Pd, the achievable hardness is lower. The
hardening response of Ga alloyed Pt is reported to be unstable and therefore classified as non-viable for reliable hardening by some authors [16].


Figure 1:              Conventional approach of hard palladium alloys with higher Ga content. Section of the Pd-Ga system (left) compared to the Pt-Ga system (right) calculated using ThermoCalc and TCNOBL1 database.

Experimental trials and corresponding investigations in a previous study at fem [3] focused on two alloys, one with Ru/Ga and the other with Ag/Ga/Cu. Hence no general conclusion can be made about the suitability of alloys for palladium casting depending on alloy composition. On the basis of defect analysis
on industrial castings, it seems that alloys having a relatively high Gallium content tend to have a higher susceptibility to formation of cracks in as-cast parts. Crack formation turned out to be a complex issue. In depth failure analysis revealed, that the underlying mechanism is related to particular
casting conditions and properties of investment material. It should be noted that crack-free castings of the Ru/Ga alloy have been obtained in reproducible way during casting trials at fem and are also obtained in high quality and reproducible way by several industrial casters which cooperated in that
project.

Silicon is a typical impurity that occurs in investment casting processes. If scrap material is used for remelting the removal of any investment residues is of utmost importance [2]. Such oxide residues might decompose during melting, especially under reducing conditions (forming gas: Ar/H
2
or N
2/H
2) that must be avoided. The released oxygen gets into solid solution inside the melt and evaporates during solidification to form significant gas porosity. Si forms a deep melting eutectic (Pd + Pd
3Si) at a temperature of 782°C. Such a low melting eutectic at the grain boundaries is responsible for hot tearing. An example of the catastrophic result of silicon impurities is shown in Figure 2 . The casting tree is completely embrittled. Many cracks in the parts cause multiple fractures that
occur along the interdendritic grain boundaries. Position 4 in the lower right image shows increased Si concentration determined by EDX analysis.

Figure 2:              Hot cracking due to contamination with investment residues.

3 Development process

3.1 Identification of suitable alloying elements

Potential alloying elements have been selected from the periodic table. Some elements have to be excluded, because they are volatile, toxic, allergenic or radioactive, too reactive under the typical conditions of investment casting or insoluble. The main requirements to the new alloy were:

Sufficient melting range of min 25K

Medium Hardness (130-160HV1)

Fine grain structure

The alloy 950PtRu was defined as benchmark for the development of new 950Pd alloys. 950PdRu has a promising silver-grey color compared to the grey color of most 950Pd alloys. It contains 100% platinum group metals and does therefore not require protective gas during processing. However, the fluidity
of the alloy is very low and some manufacturers do not recommend it for casting.

Only few elements remain as candidates. In order to overcome the poor casting properties of 950PdRu the following improvements are required:

Widening of the melting range  Addition of Co, Fe or Cu

Improvement of casting properties, especially form filling            Addition of Co

Optimization of the segregation, reduction of investment reactions        Addition of Sn

Improvement of color and hardness       Addition of Cr, Fe, B

Grain refining    Addition of Fe, W, Zr

Figure 3 shows the changing melting range of different 950Pd alloys were Ru is replaced by a third element (Me). On the left side of the figure we find the binary 950PdRu alloy and on the right the binary 950PdMe alloys. Some elements such as Au have hardly any effect on the melting range and the liquidus
temperature. Other elements (Ag, Cu,Cr) have a medium effect on melting range and liquidus temperature. In case of Cu relatively high amounts are required to achieve an effect. The strongest effects are shown by the addition of Co and Fe. However, because of their tendency to oxidation the amount should
be limited to maximum 2%.


Figure 3:              Effect of alloying additions to 950PdRu. Ru is replaced by a metallic third element (Me). The x-axis gives the amount of the third element in mass-percent. Calculated using ThermoCalc and SNOB3 database.

The effect of segregation during the solidification process can be simulated by so-called Scheil-Gulliver simulations. The effective melting range of an alloy usually increases, because the complete thermal equilibrium that is assumed in the equilibrium phase diagrams is not achieved during a relatively
fast cooling process. This results in a continuous change of the chemical composition of the liquid phase as the solidification proceeds and this effect is what can be studied by the Scheil-Gulliver simulations . The effect of such non-equilibrium composition changes of the melt on the solidus temperature
is shown in Figure 4 for a series of 950Pd-30Ru-Co,Fe alloys. The binary 950Pd-Ru shows a very narrow solidification range. The addition of 20 ‰ of Fe+Co reduces the solidus temperature and the segregation processes become more pronounced. The segregation of Fe and Co to the liquid phase results in
a reduction of the effective solidus temperature and allows a melting interval of about 30-100 K. This appears promising in terms of improved form filling, better feeding (reduction of micro shrinkage) and reduced investment reactions.

Figure 4:              Scheil-Gulliver calculation. Segregation of 950Pd-30Ru alloys with varying Fe and Co content.

3.2 Investment casting trials

Based on the above described consideration a series of alloy compositions was derived as shown in Table 2. 950PdRu served as benchmark alloy and was purchased from C. Hafner, Pforzheim, Germany. The alloys were prepared by arc melting from pure elements with a purity of 99,9% or better (purchased from
HMW Hauner Metallische Werkstoffe, Germany). The button shaped sample was cold rolled to sheet that was used for the centrifugal investment casting of typical trees according to Figure 5 with a mass of approx. 100 g. On these trees a basic characterization was made that comprised the determination
of color, metal release, hardness, age hardening response and microstructure. The tree contained a series of typical jewelry parts that are prone to typical casting defects. The grid was used for the testing of form filling and the plate sample for color measurements and metal release tests. Ca. 35
alloy compositions were prepared and investigated. Table 2 provides a selection of these compositions. The most promising alloys were selected and modified in the following step.

Table 2:                Alloy compositions tested in small scale trials (selection)

1.	Three-ball ring
2.	Single gate ring 
3.	Light signet ring
4.	Plate
5.	Grid
6.	Solitaire ring
7.	Double gate ring
8.	Heavy signet ring

Figure 5:              Casting tree setup and cast parts

Casting required a sophisticated process control in order to guarantee reproducible and reliable casting conditions (Figure 7). The casting machine was the model TCE10 from Topcast, Italy that allowed melting and casting within 40-60 s from the beginning of the heating process. A high quality quartz
based crucible of type „KGZ“ from Porzellanfabrik Hermsdorf, Germany was used for all casting trials. This type of crucible was proofed as suitable for platinum alloys in a previous study. The metal temperature was controlled during melting and casting with a thermal imaging camera. This allowed a detailed
evaluation of the metal temperature that is superior to the pyrometer integrated into the casting machine. Even the flask temperature could be controlled by thermocouples mounted onto the tree or close to the interior flask surface to document investment overheating. However, such measurements require
very high effort and where therefore used only in a very limited amount of casting trials.

The flask temperature was selected depending on the size and shape of the parts and was 650°C in most casting trials. This temperature showed the best compromise of high form filling and low shrinkage porosity. In order to reduce investment reactions as far as possible a two-part phosphate bonded investment
powder was used (Ransom&Randolph Platinum). After casting, the parts underwent nondestructive testing by computer tomography and by conventional metallography.

Figure 6:              Casting machine and process control (description see text)

Optimized form filling requires a suitable tree-setup. Based on the experience of previous casting projects with platinum, the parts were mounted on the leading side relative to the spinning direction of the casting machine. Figure 7 illustrates the casting setup, the acting forces and an example of
the simulation of the form filling process. Due to the mounting of the parts on the leading side the metal is forced to flow to the tip of the tree. The parts are then filled gradually from the tip towards the ingate of the tree. Details on the investment casting process and the casting simulation can
be found in [18, 19].

Figure 7:              Casting conditions in centrifugal casting. Orientation of the parts on the leading side of the tree. relative to the acting forces. Blue arrows indicate the rotation direction. Arrows indicate the acting forces: orange (inertia), red (gravity) green (resulting force). Simulation
of the form filling process.

After casting the tree was cut and documented as shown in Figure 8. The surface quality was assessed using the appearance of the plate sample. The grid sample provided information about the form filling, which was given in percent of the filled node points of the grid. Metallographic inspection was made
on the single and double gate rings that are prone to shrinkage porosity. The metallographic section of the plate sample was used for color measurement before and after a metal release test in artificial saliva. The results were categorized into three categories that are given in
Figure 9 for form filling, investment reaction and porosity. The microstructure and grain size were determined using scanning electron microscopy. Possible defects such as cracks, chemical inhomogeneity or inclusions were investigated ( Figure 10).

Figure 8:              Casting results and evaluation routine (description see text)


Figure 9:              Evaluation criteria for form filling, surface quality and porosity

Figure 10:            Microstructure in the as-cast condition of selected alloys

Table
3:                Main results of selected alloys in full-size casting trials

Table 3 provides the results of some selected alloy compositions. 950PdRu shows good basic properties with medium grain size and only very few intergranular cracks. The addition of Co reduces grain size and helps to completely avoid cracking. Fe additions are promising in reducing grain size, but cause
issues with heavy gas porosity. Despite that fact Fe as kept as potential alloying element. Cu brought no real advantages and reduced hardness resulting in distorted rings already during devesting. This led to the exclusion of Cu. Adding Cr resulted in too strong reactions with the investment and heavy
cracking hence Cr was excluded from the study. The addition of Sn significantly changed the grain morphology, which was rated as disadvantageous. However, the form filling was very good and the overall performance was good which kept Sn on the list of promising alloying elements.

Finally, the alloys marked in green were studied further while those marked in red were excluded from the study. Based on this evaluation the most promising alloys were selected and optimized in further steps by adding additional alloying elements. All alloys showed low hardness at this stage of development,
therefore the focus of further improvement was on increasing the hardness.

In order to improve hardness the literature provided boron (B) and aluminum (Al) as promising alloying elements [20, 21]. However, both elements are not easy to add due to their high reactivity. This required the preparation of pre-alloys with carefully adjusted amounts of Al and B. Using such pre-alloys
enabled the caster to prepare alloys that contain Al and B without the risks of oxidation during initial melting of the alloy. It further enabled the manufacturer to control the amount of alloying addition very precisely. Figure 11 provides results at different levels of B and Al. Small additions of
1‰ B (alloy PD1502) increase strength and hardness significantly while maintaining ductility. Additions of Al have a similar effect, but much higher amounts of Al are required. An approximately linear increase of strength and hardness was found.

These results were determined by tensile testing of rods that were cast into copper molds. Such casting results in fast cooling and might not be representative for investment casting. Therefore, further tests were done by investment casting. Strength levels and hardness are maintained by investment casting,
but ductility is significantly lower. This is typical and is usually an effect of the coarser and columnar grain structure after investment casting.

Figure 11:            Mechanical properties of selected alloys based on 950PdRu with additions of B and Al

Further optimizations in additional casting trials resulted in the compositions provided in Table 4. The boron content was reduced for safety reasons, because higher level of B might cause hot cracking under inappropriate cooling conditions. A combination of Al and B provided the best and reliable properties
in repeated casting trials. The combination of metals was more effective than single additions of even higher amounts. Alloy variations using Fe and Sn provide the benefit of grain refinement and improved form filling, respectively.

Table
4:                Compositions of optimized alloys meeting the hardness requirements

A comparison with other high caratage white alloys (Figure 12) shows some specific benefits of the newly developed 950Pd alloys. Compared to 950PdRu the hardness is significantly increased to levels of 140-160 HV1, which is considered optimum. Higher hardness might be beneficial for improved scratch
resistance but compromises the formability of the material during stone setting. The alloys show some age hardening response that might be used, if higher hardness is required. The comparison with state of the art 950 platinum alloys (green columns) shows superior properties over 950PtRu, but lower
hardness than 950PtRuGa, which is sometimes considered as too hard. The hardness is also comparable to 18k Pd white gold alloys that contain zinc for improved hardness (yellow column).

Further properties that should be considered are color and density of the alloys. For white alloys the yellowness index (YI D1925) is the accepted standard for color assessment [22]. YI values below 18 are considered as “premium white”, which means that the alloys do not require rhodium plating. 950PdRu
based alloys show YI values of below 10, which is comparable to 950Pt alloys. The color difference between 950PdRu and 950PtRu is hardly visible by a human observer. In contrast, premium 18k Pd white gold alloys with a YI value around 18 appear much more yellow. The density of 950PdRu based alloys is
close to 12 g/cm³, which is 60% of 950Pt alloys and 75% of 18k white gold alloys. The lower density enables the manufacturer to produce bulkier jewelry at the same weight or light jewelry, e.g. earrings or pendants. The combination of the properties labels the newly developed 950PdRu alloys as
“light, bright and strong”.

Figure 12:            Comparison with commercial alloys (typical properties according to [23])

4   Summary and Conclusions

The present paper describes the development of 950Pd alloys with improved properties for jewelry applications. Promising alloy compositions were selected based on thermodynamic calculations, which were then melted and cast by centrifugal investment casting. Typical crucibles and investment materials
that proofed to be suitable for platinum alloys were used. These materials were found to be suitable for 950Pd alloys as well. The melt was overheated by ca. 80°C prior to casting. The flask temperature was 650°C in most casting trials. Alloys containing boron can be sensitive to flask quenching. Therefore,
the flasks should be cooled slowly to room temperature before devesting.

The new alloys are based on 950PdRu and contain additional alloying elements to widen the melting range (Co, Sn, B), to reduce grain size (Fe) and to increase hardness (Al, B). Typical liquidus temperature of such alloys was 1560-1570°C, which is slightly lower than 950Pd50Ru. The addition of the above
mentioned alloying elements increases the hardness from ca. 100HV1 of the soft binary alloy 950PdRu to 140-160 HV1. This hardness range is assumed to be the ideal hardness for stone setting and finishing that provides sufficient scratch resistance during jewelry wearing. Such hardness is also reached
for medium to hard 950Pt alloys of Ni-free 18k white gold alloys. The color of 950Pd alloys is comparable to 950Pt. Both groups of alloys show a yellowness index of about 1, which is significantly whiter than Premium white gold alloys (YI <18). The density of 950Pd alloys is ca. 40%and 25% lower
compared to 950Pt and 18k Pd white gold, respectively. The low density is an advantage for light or bulky jewelry items.

The binary alloy 950PdRu suffers from the low hardness. The new 950Pd alloys show superior hardness while maintaining good form filling ability, low crucible and investment reactions and sufficient resistance to hot cracking wit suitable process conditions. They might therefore enable 950Pd alloys to
become an option for jewelry applications.

5   Acknowledgements

Norilsk Nickel, Russia, is acknowledged for financial support of this work. Linus Drogs (AuEnterprises, USA) is acknowledged for supporting this project and consulting during its realization. The colleagues at fem are kindly acknowledged for their contribution to SEM investigation, metallography and
chemical analysis.

6   References

1.            Swan, N. and B.J. Williams.
Palladium – light, bright and precious – a world view. in
The Santa Fe Sympoisum. 2006. Albuquerque, USA.

2.            Battaini, P.
Investment casting behavior of palladium-based alloys. in
The Santa Fe Sympoisum. 2008. Albuquerque, USA.

3.            Fischer-Bühner, J., A. Basso, and M. Poliero.
Challenges for Palladium Casting Alloys. in
The Santa Fe Sympoisum. 2009. Albuquerque, USA.

4.            Fryé, T.
Palladium casting: an overview of essential considerations. in
The Santa Fe Sympoisum
. 2006. Albuquerque, USA.

5.            Battaini, P.
The working properties for jewelry fabrication using new hard 950 palladium alloys. in
The Santa Fe Sympoisum. 2006. Albuquerque, USA.

6.            Mann, M.B.
Palladium: manufacturing basics for servicing, assembly and finishing. in
The Santa Fe Sympoisum. 2007. Albuquerque, USA.

7.            Johnson-Matthey.
JM jewellery alloys. Available from:

http://www.noble.matthey.com/jewelry

.

8.            Hafner, C.
Palladium alloys
. Available from:


http://www.c-hafner.de/de/leistungen-und-produkte/edelmetall-produkte/werkstoffe/werkstoffe-fuer-schmuck-und-dekorative-anwendungen/

.

9.            Heimerle+Meule.
WKD_189-950. Available from:


http://www.heimerle-meule.com/fileadmin/dateien-global/02_Products/Schmuckhalbzeuge/Produktuebersicht/Werkstoffdatenblaetter/Legierungen/Pd_500_585_950/englisch/WKD_189-950eng.pdf

.

10.          Wieland. 2016; Available from:


http://www.wieland-edelmetalle.de/produkte/schmuckhalbzeuge/palladium/page.html?L=0

.

11.          Agosi.
Agosi palladium alloys
. Available from:


http://www.agosi.de/wp-content/uploads/2015/09/AG_AgosiManufaktur.pdf

.

12.          Legor.
Legor palladium alloys
. Available from:

http://products.legor.com/EN/download

.

13.          Hoover&Strong. 2016; Available from:


https://www.hooverandstrong.com/media/pdfs/MaterialSpecs-950Palladium-01-2015.pdf

.

14.          UnitedPMR.
950 Palladium Grain (PD950). 2016; Available from:

http://www.unitedpmr.com/palladium_950_grain.php

.

15.          Klotz, U.E., et al.

Platinum investment casting: material properties, casting simulation and optimum process parameters
. in
The Santa Fe Sympoisum
. 2015. Albuquerque, USA.

16.          Biggs, T., S.S. Taylor, and E. van der Lingen,
The Hardening of Platinum Alloys for Potential Jewellery Application.
Platinum Metals Review, 2005.
49(1): p. 2-15.

17.          Kretchmer, S.,
Heat-treatable platinum-gallium-palladium alloy for jewelry. 2003, Palenville, NY, US.

18.          Heiss, T., U.E. Klotz, and D. Tiberto,
Platinum Investment Casting, Part I: Simulation and Experimental Study of the Casting Process. Johnson Matthey Technology Review, 2015.
59(2): p. 95-108.

19.          Klotz, U.E., T. Heiss, and D. Tiberto,
Platinum Investment Casting, Part II: Alloy Optimisation by Thermodynamic Simulation and Experimental Verification.

Johnson Matthey Technology Review, 2015.
59(2): p. 132-141.

20.          Böhm, W.,
Legierung auf der Basis von Platin, Palladium oder Gold. 2011.

21.          Blatter, A., J. Brelle, and R. Ziegenhagen,
Allaige à base de palladium. 2006, PX Holding S.A., 2304 La-Chaux-de-Fonds, CH.

22.          Henderson, S. and D. Manchanda,
White gold alloys. Gold Bulletin, 2005.
38(2): p. 55-67.

23.          Fryé, T. and U.E. Klotz.
Mechanical properties and wear resistance of platinum alloys: a comparative study. in
The Santa Fe Symposium on Jewerly Manufacturing Technology. 2018. Albuquerque, NM, USA: Met-Chem Research.

Continue reading